Showing posts with label Market Outlook. Show all posts

Tuesday 1 November 2022

Likely Property Crisis in Singapore- A drop of 30%?

Contributed by: The Big Fat Whale


In recent times, despite the upheaval around the world, the Singapore property market has been holding well. It is still on an upward trajectory that makes it like "Not being in the game is a fool's play".

It has been one of the surefire ways to build your golden nest by upgrading from your first BTO HDB to a private property and to another private property every 4-5 years to escape the Sellers Stamp Duty. Not many have not reaped returns using this foolproof path.

There is an interesting Tik Tok video where the content creator was mentioning that his property agent is pitching a newly launched condo as a sure-proof way to lock in profits after 5 years of holding. It is along the line of just buying the property at 1.5 million now and cashing out at 2 million 5 years later.

Then it shows the speech by our deputy Prime Minister who said no one he has known could have predicted property prices in the future. Moreover, this development is situated in a non-prime area which makes the pitch less convincing.


Property Price Trend

Singapore Property Price

Source: Trading Economics- Singapore's Residential Property Price

From the chart above, you can see property prices have been a worthwhile holding if you. have a time frame of 10 years or more.  The two notable periods where there was a profound correction would be the Asian Financial Crisis in 1997 and the Global Financial Crisis in 2008.

During the Asian Financial Crisis, prices plunged close to 40% and it took nearly a decade for those who got at the peak to be back to breakeven in 2007. The stock market declined by 60% during this period. We can affirm this as a friend who bought a condo unit at the peak of 1997 saw his property valuation come back to breakeven only ten years later. It is his version of the "Lost Decade".


Click Here for the Full Article:

/https://thebigfatwhale.com/likely-property-crisis-for-singapore/

Friday 21 October 2022

Demystifying Singapore's Government Debt to GDP of 130%

Contributed By: The Big Fat Whale


To be frank, we were very surprised when we saw Singapore at the top of the table for countries with the highest government debt to GDP.  Is it a worrying sign? Or is there more to it than what the figures are implying?

Therefore, we decided to take a deeper look by doing some research.

Debt to GDP

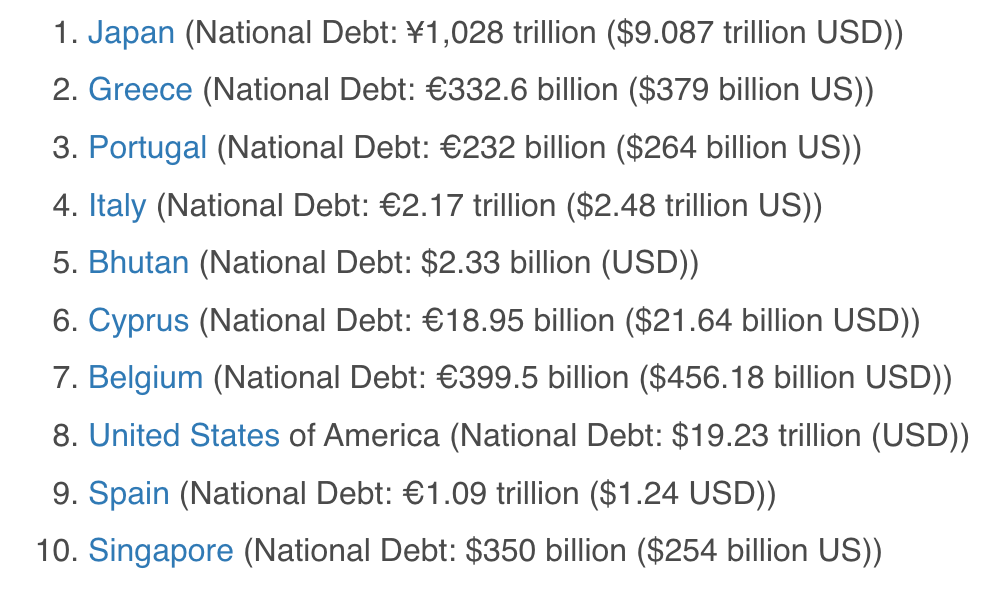
Source: worldpopulation.com- Top 10 countries with the highest Debt to GDP in 2022


Debt Instrument Issued

Firstly, let's break down the different debt instruments that the Singapore government issued for their debt.

  • Singapore Savings Bond
  • Singapore Government Securities
  • Special Singapore Government Securities
  • Treasury Bills

Singapore Savings Bond is issued to give Singaporeans a debt instrument they could invest in to grow their money efficiently and safely to counter inflation. They are issued with a 10 years tenure and could be redeemed at any time with no loss of capital.

Singapore Government Securities is issued to promote the debt market in Singapore and could be used as a benchmark to price corporate bonds. They are issued with maturities of 2, 5, 10, 15, 20, and 30 years.

Special Singapore Government Securities are issued to provide returns for Singapore's State Pension, the Central Provident Fund. The securities earn the CPF Board a coupon rate that is pegged to the CPF rate the members receive.

Here are some details of the interest that members will receive. The member will earn 5% per year on up to the first $60,0000 of their Retirement, Special and Medisave Accounts if their Ordinary Account is less than $20,000. Also, they earn an additional extra interest of 1% per year on the first $30,000 of their CPF balances after age 55. This means they can earn up to 6% per year on the first $30,000 in their Retirement Account.

Treasury Bills are short-term debt instruments that are issued with a 1-year maturity. It is used to bridge and smoothen the cash flow from the operations of the government on a day-to-day basis.


Is Singapore in a Precarious Situation?

Singapore's government mainly borrow money not to fund the running of the country which is usually depicted in the yearly budget. In recent times, the UK is trying to borrow more so as to fund its proposed tax cuts and it has led to an all-time low for the sterling. 

Singapore's government borrow to fund infrastructure projects that will turn into assets once they are completed. Some notable projects funded by past government debt are the large initial costs for Changi Airport and the first MRT lines in the 1970s and 1980s,  There will be cashflow from the funded projects after completion which will lead to generating investment returns and contribute to the revenue of the nation.

Projects that will be financed by the government debt in the future will be the expansion of rail lines, major highways, other green projects and more importantly a sea wall that will protect Singapore from rising water levels due to climate change.

Based on Singapore's constitution and government securities act, it is not allowed to spend the funds raised through debt securities.  Therefore, the bulk of it is invested in infrastructure projects that have national interest. 

There are also safeguards to rein from an overdose of debt for infrastructure with a cap currently at 90 billion dollars which is around 20% of current Singapore's GDP.


Singapore is One of the World's Top Net Creditor
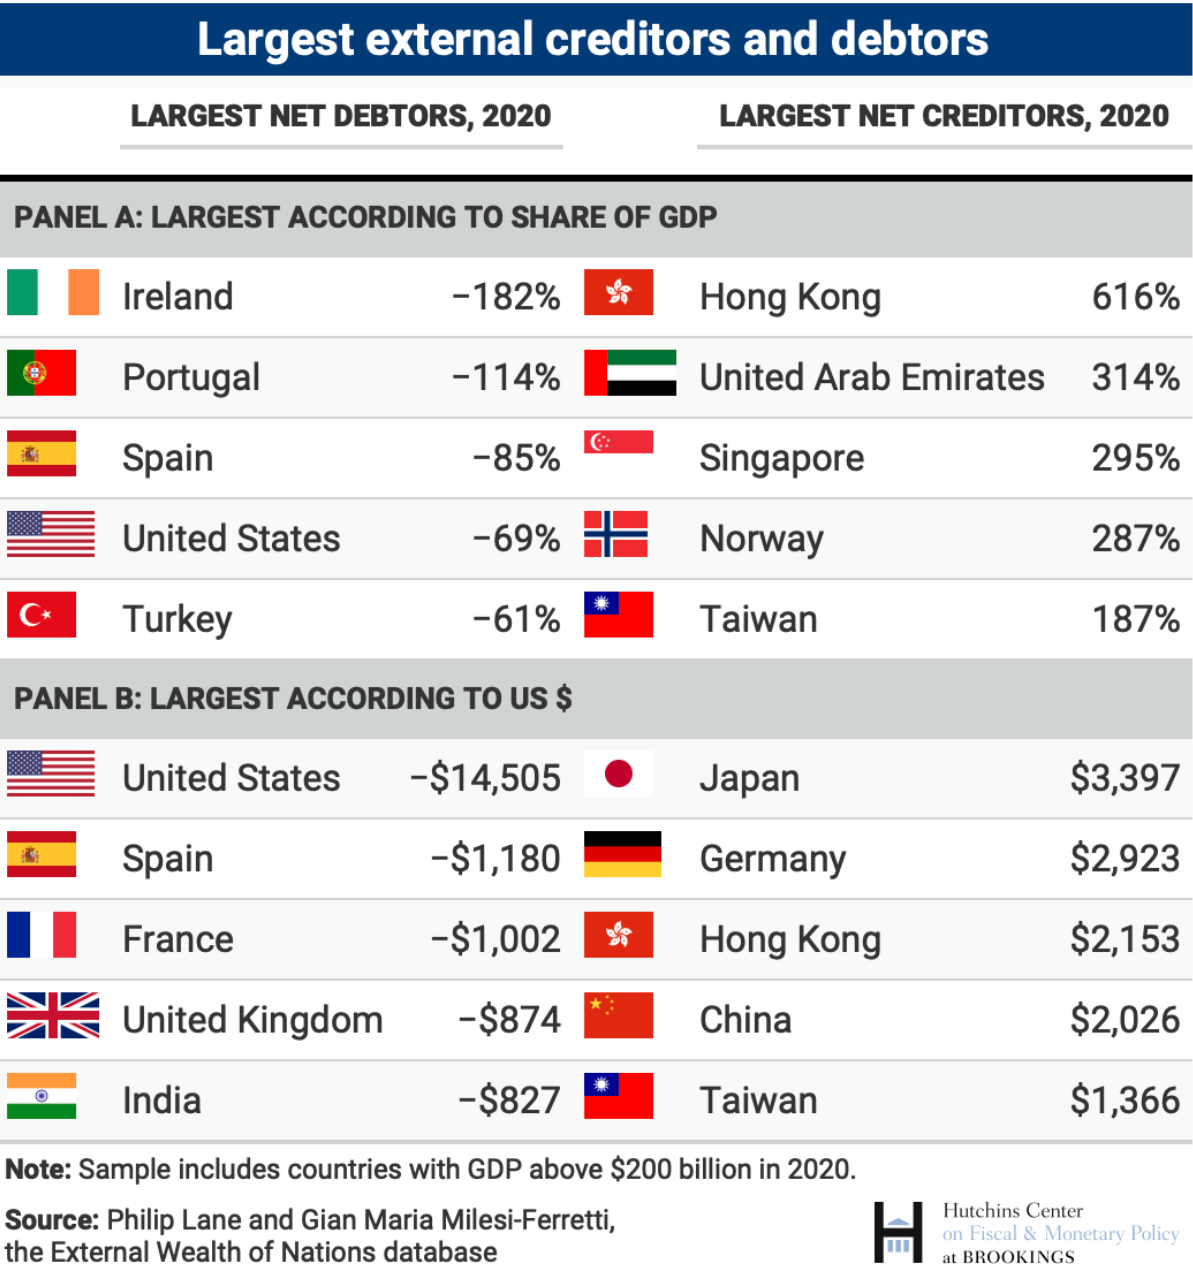
Source: Brookings

From the computed statistics shown, Singapore is one of the top net creditors according to the share of GDP in the world. Therefore, based on our earlier discussion, if we take the value of the assets that were financed by the debt, and deduct the debt amount, we are in a very healthy position.


Summing Up

Headline figures of 130% of government debt to GDP for Singapore would send uneasy signals if we do not look deeper into the figures. 

So based on our research, the debt is used to finance mainly infrastructure projects that would generate investment returns in the future once completed.  With these turning into cash-generating assets, the implication would be that Singapore is actually a net creditor when we take the assets minus the debt. 

On top of that, the reserves of Singapore which are managed by MAS (S$510 billion), Temasek (S$381 billion) and GIC (In excess of S$100 billion) as of 31st March 2021, which would put us in good stead to face any turbulence ahead with a trillion dollars of a buffer.


We hope you liked this write-up and do subscribe to our website to receive insightful articles whenever they are published.


Disclaimer:

The content here is for informational purposes only and should NOT be taken as legal, business, tax, or investment advice. It does NOT constitute an offer or solicitation to purchase any investment or a recommendation to buy or sell a security. The content is not directed to any investor or potential investor and may not be used to evaluate or make any investment. Do note that this is not financial advice. If you are in doubt as to the action you should take, please consult your stockbroker or financial advisor.


Saturday 15 October 2022

US Treasuries- A Screaming Buy?

Contributed By: The Big Fat Whale


The skyrocketing interest rate environment where fixed deposit promotional interest rates in Singapore have crept up beyond 3% for some banks is unheard of.

The last time the fixed deposit interest rate went up above 3% was in 1998. Savers and property owners on mortgages have been used to a low-interest rate environment for a long time.

With any hints of a crisis, the central banks have been very proactive in their quantitative easing policies that have flooded the financial markets with excessive liquidity.

That has led to euphoric bubbles with most now being tamed. The surprising element was inflation was accommodative during this period as it just nudge nicely along.

However, what changed the overall game plan in recent times was inflation is turning into a beast with the US latest figures hitting above 8%. The parallel scenario would be the 1970s period when the overall economy was in a stagflation mode- High inflation but low growth.

They only managed to finally curb the inflationary pressures when the US central bank go all out by increasing the interest rates to 20% in 1980. The current Federal Interest Rate is at 3.25% with the expectation of it reaching 4% in the near term.

Not taking into consideration the recent ultra-low interest rate environment over the past decade, the normal sweet spot for interest rates would be around 2%-5% region. Therefore, if you look at it, we are just back to a normalised situation.


US DebtCurrent Yield
2 Yr4.35%
10 Yr4%
30 Yr3.95%

Source: Investing.com- US Treasuries Yield

Given the backdrop, it is no surprise that US Treasuries are looking attractive with 2 Years Bills giving a yield of 4.35%.

Giving some perspective, a decent corporate bond in Singapore in the pedigree of AllGreen and Straits Trading is currently giving a yield of 4%-4.5% and has an expiry date of close to 3 years.

The latest Singapore Treasury Bill auction in October for 1-year yields 3.7%.


Click Here for the Full Article:

https://thebigfatwhale.com/us-treasuries-a-screaming-buy/

Saturday 30 April 2022

Recession Oncoming- Forecasted by the Inverted Yield Curve

Contributed by: The Big Fat Whale

If the financial markets have a crystal ball, it would be everyone's dream to grab hold of it.

Today, we are going to share with you, an indicator that has successfully preceded a recession since 1955 except for once in the mid-1960s. There was an economic slowdown rather than a recession but the forecasting prowess should not be undermined.

Uncannily, the latest inversion was in 2019 that preceded the market crash caused by Covid 19 in March 2020.


Inverted yield Curve

Source: JP Morgan Asset Management - For the 2020 recession in April, it took 8 months to recession after the inversion.


On April 1st 2022, the 2 years and 10 years of US Treasuries rate saw an inversion again. It would be foolish to ignore it given their track record of predicting a recession and economic slowdown.


Click Here for the Full Article:

https://thebigfatwhale.com/recession-oncoming-forecasted-by-the-inverted-yield-curve/ 


Tuesday 15 March 2022

How to Invest in a Bear Market? - Advice from a Veteran Fund Manager with 54 years of Experience


If you are heavily invested in China Tech, it is not an easy time in the past few weeks. Baba has fallen by 30% within a week and the end seems not in sight. Even the almighty Tencent was not spared from this perfect storm.

The reasons for their drop could be from the possible implications of delisting from the US, China's regulatory claw and the more likely cause which is similar sanctions imposed on Russia slapped on the Chinese companies.

Would the US and its allies impose drastic sanctions on China? Based on a realistic assessment, it is unlikely to happen as China is playing the neutral role well so far. However, it was also unlikely too for Russia to wage a war on Ukraine without negotiations so it is anyone's guess in this crazy world.

It has been a long while since I saw HSI testing 18000 levels, the way it is going, it looks like they are going into bankruptcy administration. Many of the companies are currently trading close to value stocks status despite their growth characteristics. Tencent at PE of 12 and Baba at PE of 11 (excluding one-off writing down of goodwill).

The Chinese Government have to step in soon unless they want to have a crumpled capital market which will not be in line with their goal of China being strong, independent and vibrant. Statements to provide support for the Chinese market would be most welcome in such dire conditions.


They have shown their prowess and proven their point that no one is on top of the powerful government. Jack Ma is nothing but just a cloud in the sky. Is it perhaps time to spare the rod and shower some care and concern?

The merits of being able to do valuation of a company based on financials rather than concepts would come in useful at this juncture. If we are convinced China would not let their titans fall, this is the time to be brave and accumulate the "best of the class stocks" in China.  

The Graham crowd would be excited to hunt for gems in this current massacre of China's market where Mr Market is getting moody and throwing bargains at us. Even strong names like Ping An is not spared this time around.

Here is some advice from a veteran portfolio manager with 54 years of experience from Royce Investment Partners as he gives his input on how to invest in a bear market. I hope you will find it useful to navigate the current challenging conditions.


What’s your take on the sharp market decline?

I think it was overdue and I believe we have more to go. The reason that I think more drawdowns and declines are likely is the Fed has yet to implement the measures they need to take to restrain and hopefully bring down inflation.

I feel that they’re dramatically behind the curve, meaning that they have to catch up to do. They should have been removing stimulus and should have been raising rates earlier. They haven’t done so. And that’s ahead of us.

Do you think there are other parallels in your career?

I’ve been doing this professionally for 54 years, which means I was actually a young portfolio manager managing a pension fund in 1972-75, also known as the Nifty Fifty era. And this was at a time when, much like the FANG stocks of today, there was an anointed group that sold at very high valuations. We’ve obviously seen this in the dot.com bubble. It repeats itself. So history is a good instructor in these matters.

And the market, from top to bottom, went down 50%. That insight that I learned then was instilled in me by a veteran trader. And he says to me, Charlie, hold your horses. This is the beginning of a bear market. What you’ve got to do is you’ve got to pace your purchases, dollar cost average. You don’t know how long this is going to take.

So what I learned then was a pyramid. What you do is you buy, think of the top of the pyramid, you buy a little. And as the price declines, you buy more. And on days that market goes up, you stop buying, on the presumption, it’s going to go down tomorrow or the day after.


Here is the link for the Full Article:

https://www.royceinvest.com/insights/2022/1Q22/how-a-veteran-pm-invests-in-bear-markets

Monday 14 March 2022

Navigating the Investment Landscape in a Stagflation World- Revisiting the 1970s

Contributed By: The Big Fat Whale

Stagflation is the buzzword in recent times. The definition of stagflation will be persistent high inflation combined with high unemployment and stagnant growth in a country's economy.

The most relatable period in which we can have insights into the impact of stagflation would be a relook into the 1960s-1970s period. This was the only time in modern history(20th and 21st century) that this economic phenomenon has happened.

Inflation was persistently above the 8% mark throughout the period from 1972 to 1981.


History Rhymes

As Mark Twain famously quoted:

"History does not repeat itself but it certainly rhymes"

There are many market analysts and commentators that dismissed the possibility of stagflation happening and argue that the situation is different this time. One of the main arguments is that stagflation is caused by the oil shock in the 1970s which send oil prices spiralling up and the US was heavily dependent on it.

Currently, the US is a net exporter of oil as they have the largest shale oil reserve in the world and with the advent of alternatives (Solar, Wind and Nuclear), the impact of oil on the economy would be less pronounced.

But we might not have an oil shock but a debt shock could be on the cards which have been built up from trigger happy Quantitative Easing in the past. Debt to GDP is at a record of 124% versus 35% in the 1970s.


Click Here for the Full Article: 

https://thebigfatwhale.com/navigating-the-investment-landscape-in-a-stagflation-world-revisiting-the-1970s/

Monday 14 February 2022

No Cash, No Bonds, Good Geographical Diversification for the New Norm- Ray Dalio


Chanced upon this latest interview by Ray Dalio that give advice on the current economic outlook and the geopolitical situation. It is worth your time to digest.

Just a little introduction on Ray Dalio:
Ray Dalio, founder and co-chief investment officer, Bridgewater Associates — the world's biggest hedge fund — manages $150 billion in assets. With over 50 years of experience in macro investing, 72-year-old Dalio has been successful in creating a practical investing template by analysing patterns in history and has helped Bridgewater’s flagship Alpha Fund clock net gains of $46.5 billion since inception in 1991. Dalio’s book, Principles for Dealing with the Changing World Order, examines the big cause-effect relationships of economic events that have shaped the world we live in.

In his latest interview with Fortune India, Ray Dalio discusses his macro-investing template. Here’s an excerpt from the interview:
Dalio: I want a highly diversified portfolio of assets that are not cash and bonds.
I want geographic diversification as much as I want asset class diversification. Regarding my geographic diversification I want to favour countries that have three characteristics and are healthy in the ways we talked about:
First, they are financially strong, that is, their incomes are greater than their expenditures and their assets are greater than their liabilities.
Second, I want countries in which there is internal order rather than internal conflict so that then they can be productive.
Third, I don’t want to invest in countries where there are significant chances of external conflict.
I create two portfolios — first, a portfolio of assets that perform best in bad times and retain their value in the worst of times. And second, a diversified portfolio of the investments.

You can read the entire interview here:
https://www.fortuneindia.com/long-reads/the-conversation-ray-dalio/107064?fbclid=IwAR3SWyRBM-gycDOEivZEvDMFwGo_IEtj5Gi8jgVNgBgIX-LtH0_NFxmqDns

Monday 27 December 2021

6 Indicators to Gauge if S&P 500 is Peaking

Contributed By: The Big Fat Whale

The market has been on a tear ever since its huge 35% correction in March 2020- S&P index drop from 3400 to 2200- due to the Covid 19 pandemic. It has more than doubled from the bottom to its current level at 4650. 

So what's the outlook ahead?

Is it on a never-ending trajectory to the moon?

We will be looking at 6 indicators and the chart of S&P to give us some indication if things are getting way too hot that will lead to the imminent meltdown.

The power of the Fed printing machine has worked wonders. But is the market getting too complacent?


Buffet Indicator


Buffet Indicator

Source: www.currentmarketvaluation.com

The Buffett Indicator is defined as the value of a country's publicly traded stocks divided by its gross national product. The greatest investor of our lifetime, Warren Buffet, have used this indicator to assist him to gauge where the valuation of the market stands at any moment in time. 

We are now way off the charts and looks excessively overvalued. If the market just reverts to the historical trendline, it could easily be a 50% correction


Click Here to Read More:

https://thebigfatwhale.com/a-look-into-6-indicators-to-gauge-if-the-market-is-peaking/ 

Saturday 25 December 2021

Fed's Latest Move- Demise of ARKK and Innovation Stocks?

Contributed by: TheBigFatWhale


With the latest move by the Fed, where they are looking to have 3 interest rate hikes in 2022 and into reducing their balance sheet, growth stocks have not been faring well. The move by Fed is a move towards a monetary tightening policy that will drain the exodus of liquidity that has been pumped into the economy since early 2020. 


Fed Balance Sheet

Source: Tradingeconomics.com- Fed Balance Sheet


The Fed Balance sheet has more than doubled since 2020 which is a worrying sign that things are going out of control. Therefore, the indication by Fed to reduce their balance sheet is a sound and prudent move provided they are really serious about doing it. We touch on our previous article about the 6 indicators to gauge if the S&P 500 is peaking with the Fed Balance sheet as one of our concerns.

With a potential stoppage of easy money, the prospects for growth stocks could be bleak. Most of the growth or innovation stocks run on the theory that they would be wildly profitable once they are able to scale. Moreover, it is the vision for the future and it will disrupt the whole way things are done. 


Click Here to Read More:

https://thebigfatwhale.com/feds-latest-move-demise-of-arkk-and-innovation-stocks-quick-thoughts/