With the US indices (Dow and S&P) scaling all time highs, the Trump presidency has led to a surprisingly positive outcome for the equity markets. In a recent seminar, I was going through the US market outlook and i summed it up through the following points:
1) Valuation
2) Quantitative Easing Ended
3) Trumpnomics
4) Debt Levels
5) Monetary Policies
6) Global Economic Conditions
7) Technical Charts
Valuation
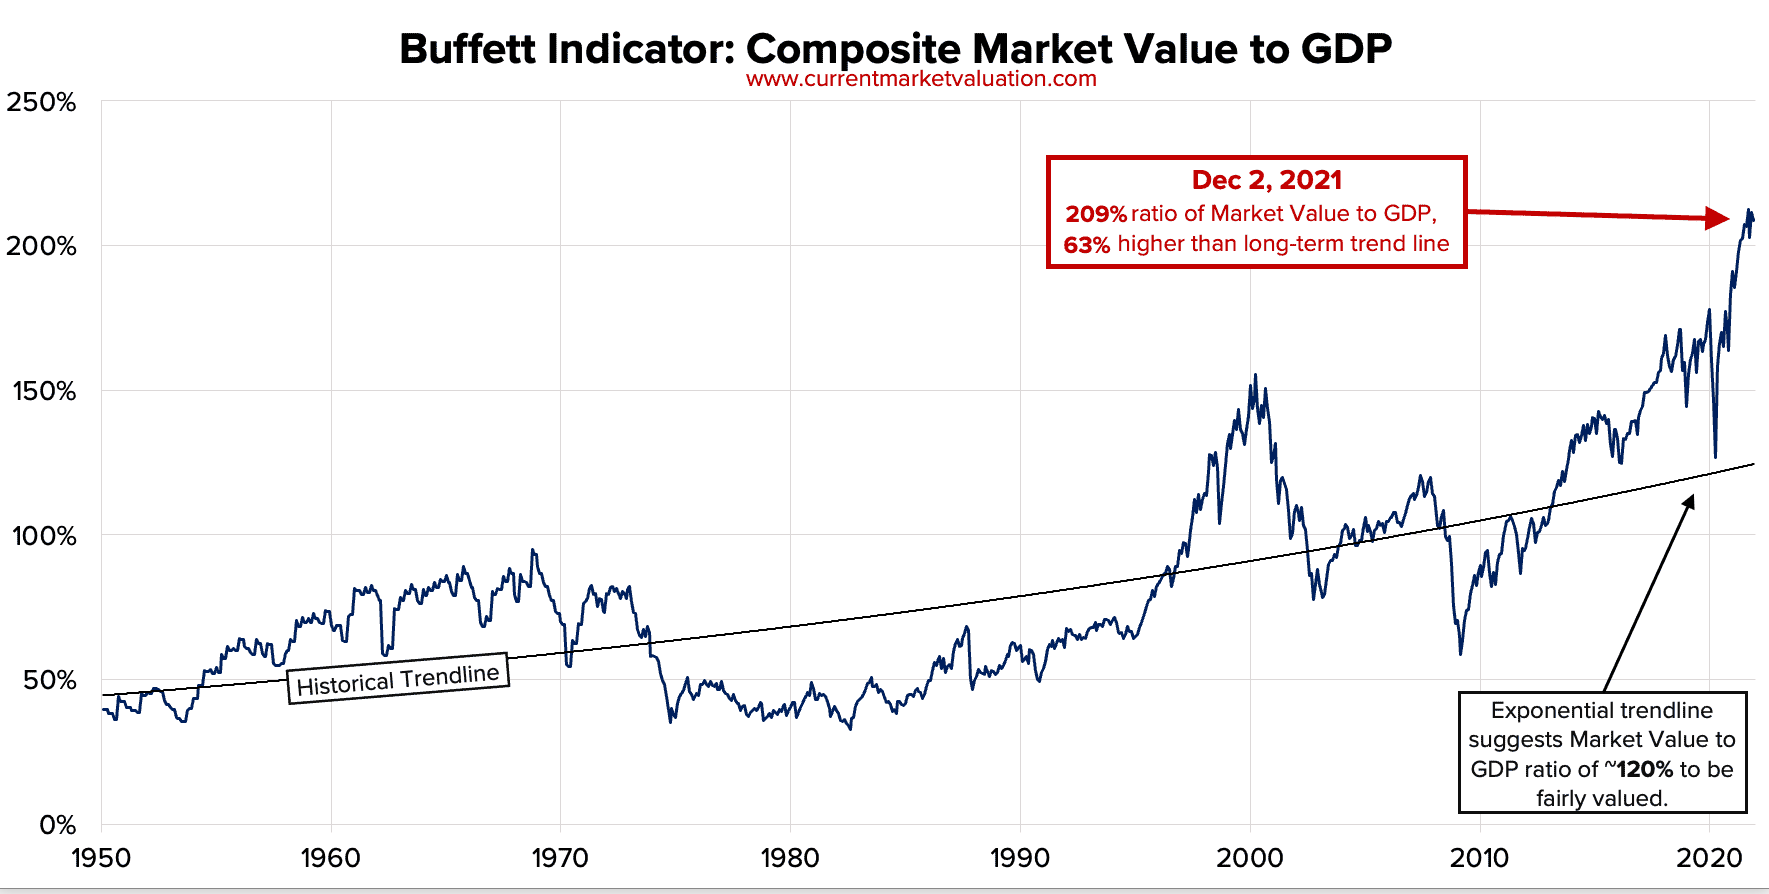
Firstly, valuation of the S&P index is at the higher end of their recent range (2006 to 2016) and their PE is around 22 at the moment. We are actually not far off from the high (PE:24) during the Lehman crisis in 2008. Looking at the Price to Book Ratio, we are near 3 which was last registered in 2008 before the huge crash. Last but not least, looking at the Cyclically Adjusted Price Earnings Ratio which could smooth out outliers, we are at around 30 which is the highest level comparable to the levels before the Great Depression in 1928-1930 period. It however did reach close to 45 during the Dotcom Bubble. Enclosed are supporting charts to justify my analysis. In summary, the US indices
definitely do not seem like a bargain from a valuation aspect.

Source: Bloomberg S&P Historical PE Ratio

Source: Bloomberg S&P Historical Price to Book Ratio
Quantitive Easing Ended. Start of a new era?
The quantitative easing (aka fossil fuel that has been driving the Dow Jones Index up from their abyss after Lehman crisis till 2015) has since taken a back seat. Now replacing it and driving the index higher in recent times will be Trumpnomics.
Trumpnomics (explained in 4 parts):
1) Taxes- Reduction in Corporate Tax and Repatriation Tax Consession
With reduction in corporate taxes and repatriation tax concession (Companies like Google and Apple have lots of funds stash in overseas tax haven places), it will drive up business and investment activities and hopefully led to a multiplier effect that will out weigh the reduction in tax revenues. However, my personal belief is that big corporations would not take the bait and repatriate all funds back as the regulation could easily change if Trump do not get reelected in the future and they would not want the US authorities to have full disclosure of their overseas funds.
2) Fiscal Policies- Infrastructure Spending with notable investment such as "Great Wall of America"
There have been plans to spend close to 1 trillion dollars on infrastructure ( ie. revitalize America's aging roads, bridges, railways and airports) over a 10 year period to create jobs and sustainable growth for the US economy.
3) America First- Trade Protectionist Measure to drive up sectors such as Car Manufacturing
There have been concrete plans to bring back jobs such as car manufacturing back to US and if necessary, trade tariffs to protect the industry. There are talks with corporate honchos to bring jobs and investments to America. Companies such as General Motors, Hyundai, Walmart, Bayer AG and Alibaba have already committed to step up investments in US. My own thoughts are trade protectionist measure tends to work in the short run and might not be sustainable. According to Adam Smith’s "Invisible Hand Theory", it is best to let countries focus on what they are most efficient in producing and it will lead to an increase in overall output. Rather than sprucing up industries which US does not have a competitive advantage, they should invest into skill training and migrating workers to other industries which US has an edge or the indispensable services industries.
4) Dodd Frank - To deregulate or to regulate?
There have been talks that there will be deregulation of the Dodd Frank Act which was enacted after the Lehman crisis. Dodd Frank Act has consumers’ interests at heart, this in turn made it extremely onerous for banks and thus affected their bottom-line. The talk of de-regulation had US financials rallied after Trump was elected. Nevertheless, this would be easier said than done - this can’t be just a one man show and it will need Congress' approval which would take a long time before they can come up with some consensus.
Debt Levels and Monetary Policy
Looking at Margin debt and Government debt level, the US is currently on a high note at around 500 billion dollars and 19 trillion dollars (106 percent to GDP) respectively. The highest level registered was around 120 percent during the 1940s. We are facing the passing of the lifting of the debt ceiling on March 15th which has been set at around 20 trillion dollars and if the debt ceiling is not lifted, the US government could not borrow anymore.
With such a huge debt load and inflation within control, I feel that the US Federal reserve would not be in a rush to lift interest rates aggressively as a lower interest would make it easier to pare down the debt level. Nonetheless, the guidance from Fed will be for 3 rate hikes this year. In general, lower interest rate will be good for the equities markets but a gradual increase would signify that the economy is doing well. What we do not wish to see is an aggressive hikes policy such as during the late 1990s under Greenspan period.

Source:Dshort.com

Source: CNBC
Global Economic Conditions
Global market conditions have been pretty stagnant and we are looking at around 1-2 percent growth for most regions whereby China has also slowed their growth to around the 6 percent region. Moreover with America First Policy, growth in other regions seem to remain status quo. Thus given such a backdrop, there is no real catalyst for sustainable growth Ex America regions.
Technical Charts
Looking at the Technical Charts, it certainly is a on a good uptrend and having breach their all time high of around 18,500, it seems the stage is set for further upside. Using Fibonaci projection, we could be looking at a potential target of 22,000 for Dow Jones in the near future.

Source:
IT-Finance.com
In short, weighing the different factors, I will be cautiously bullish and choice entry level will around 19,500-20,000 levels and a break below 18,500 would require us to revisit our bullish thesis. However, is this going to lead to multi years of bull run? My thoughts will be that the Trump policies are pretty short term positive in nature. At this juncture, I doubt it will pan out well as protectionist measures are usually not effective in the long haul. Therefore, there might be another bullish leg but the indices seems to have priced in most of the positives at this moment.
Disclaimer:
The information contained in this publication is provided to you for general information only and is not intended to nor will it create/induce the creation of any binding legal relations. The information or opinions provided do not constitute investment advice, a recommendation, an offer or solicitation to subscribe for, purchase or sell the investment product(s) mentioned herein. It does not have any regard to your specific investment objectives, financial situation and any of your particular needs. Accordingly, no warranty whatsoever is given and no liability whatsoever is accepted for any loss arising whether directly or indirectly as a result of any person or group of persons acting on this information. Investments are subject to investment risks including possible loss of the principal amount invested. The value of the product and the income from them may fall as well as rise.
You may wish to obtain advice from a financial adviser before making a commitment to purchase any of the investment products mentioned herein. In the event that you choose not to obtain advice from a financial adviser, you should assess and consider whether the investment product is suitable for you before proceeding to invest.
Any views, opinions, references or other statements or facts provided in this publication are personal views and shall disclaim any liability for damages resulting from errors and omissions contained.