Contributed By: The Big Fat Whale
The market has been on a tear ever since its huge 35% correction in March 2020- S&P index drop from 3400 to 2200- due to the Covid 19 pandemic. It has more than doubled from the bottom to its current level at 4650.
So what's the outlook ahead?
Is it on a never-ending trajectory to the moon?
We will be looking at 6 indicators and the chart of S&P to give us some indication if things are getting way too hot that will lead to the imminent meltdown.
The power of the Fed printing machine has worked wonders. But is the market getting too complacent?
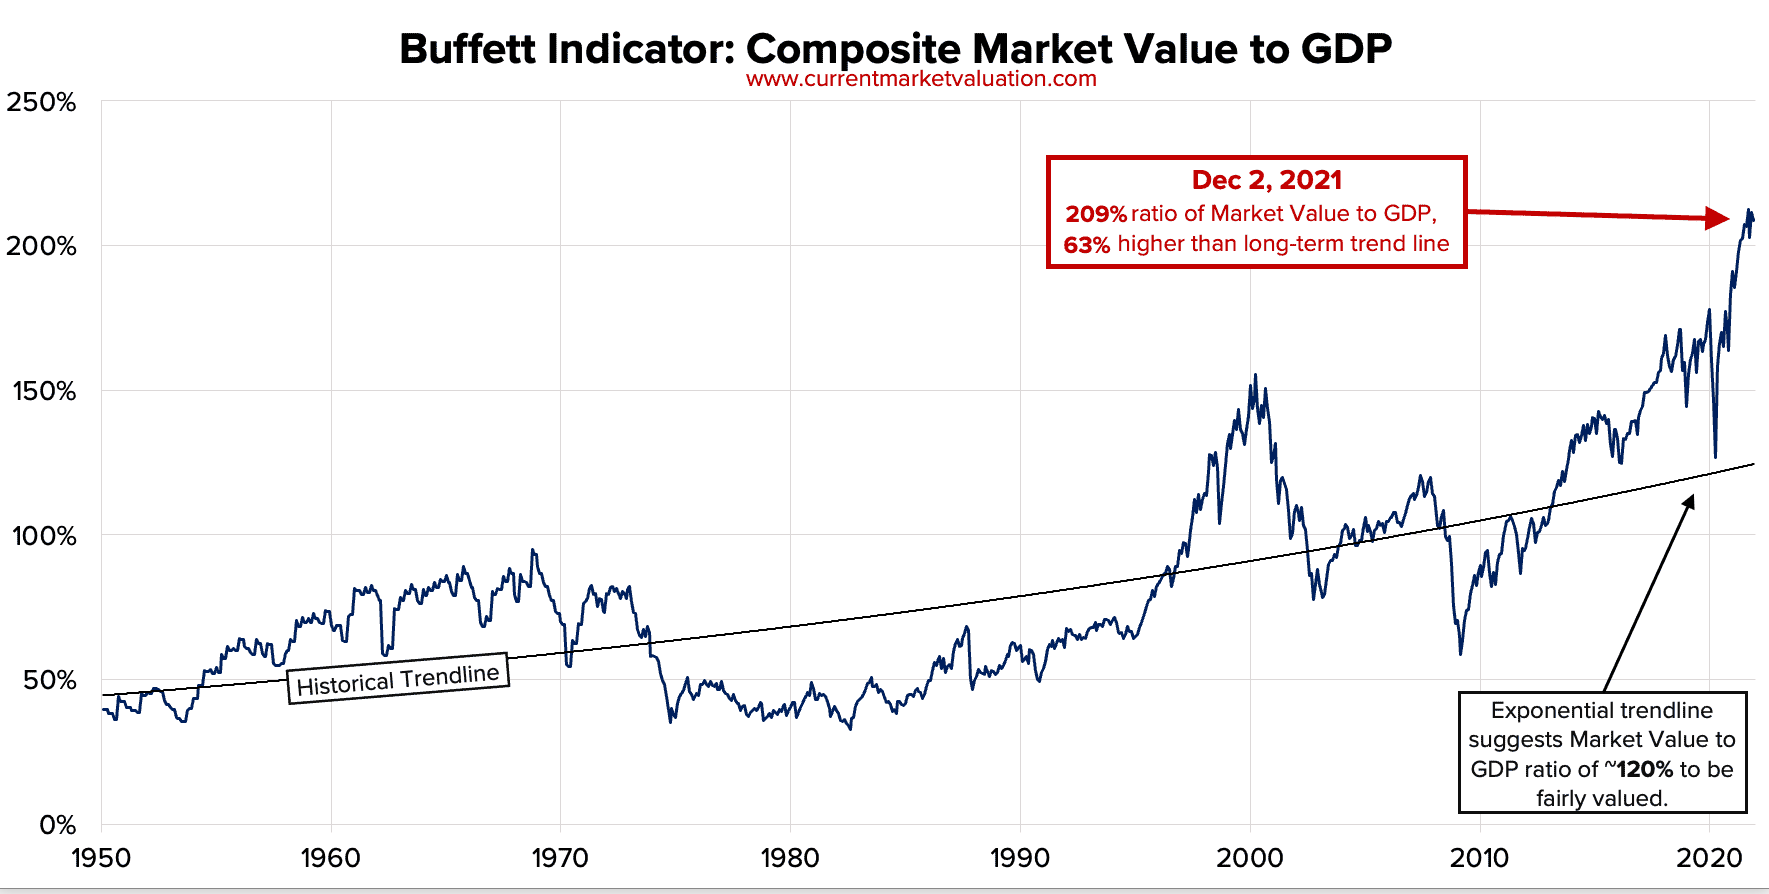
Buffet Indicator

Source: www.currentmarketvaluation.com
The Buffett Indicator is defined as the value of a country's publicly traded stocks divided by its gross national product. The greatest investor of our lifetime, Warren Buffet, have used this indicator to assist him to gauge where the valuation of the market stands at any moment in time.
We are now way off the charts and looks excessively overvalued. If the market just reverts to the historical trendline, it could easily be a 50% correction.
Click Here to Read More:
https://thebigfatwhale.com/a-look-into-6-indicators-to-gauge-if-the-market-is-peaking/

No comments:
Post a Comment