Showing posts with label Trading. Show all posts

Sunday, 5 November 2023

Traders Zone: Forex Outlook- EUR/USD Poised for more Upside?

Contributed By: The Big Fat Whale

The news of the week has been the Fed's decision to hold the Fed Rate unchanged, and more importantly, there could be a pivot from their policy (ie: a possibility of rates decreasing). 

However, with inflation still hovering around 4%, that is short of their 2% target. Thus, our view is that the Fed rate should not see a huge drift and would be stabilising at current rates perhaps till the end of the year.

For this forex outlook, our focus will be more on analysing the technical analysis of the major pairs to highlight trading opportunities for the week ahead.


EUR/USD Charting Analysis

Eur/Usd Chart

Source: Investing.com

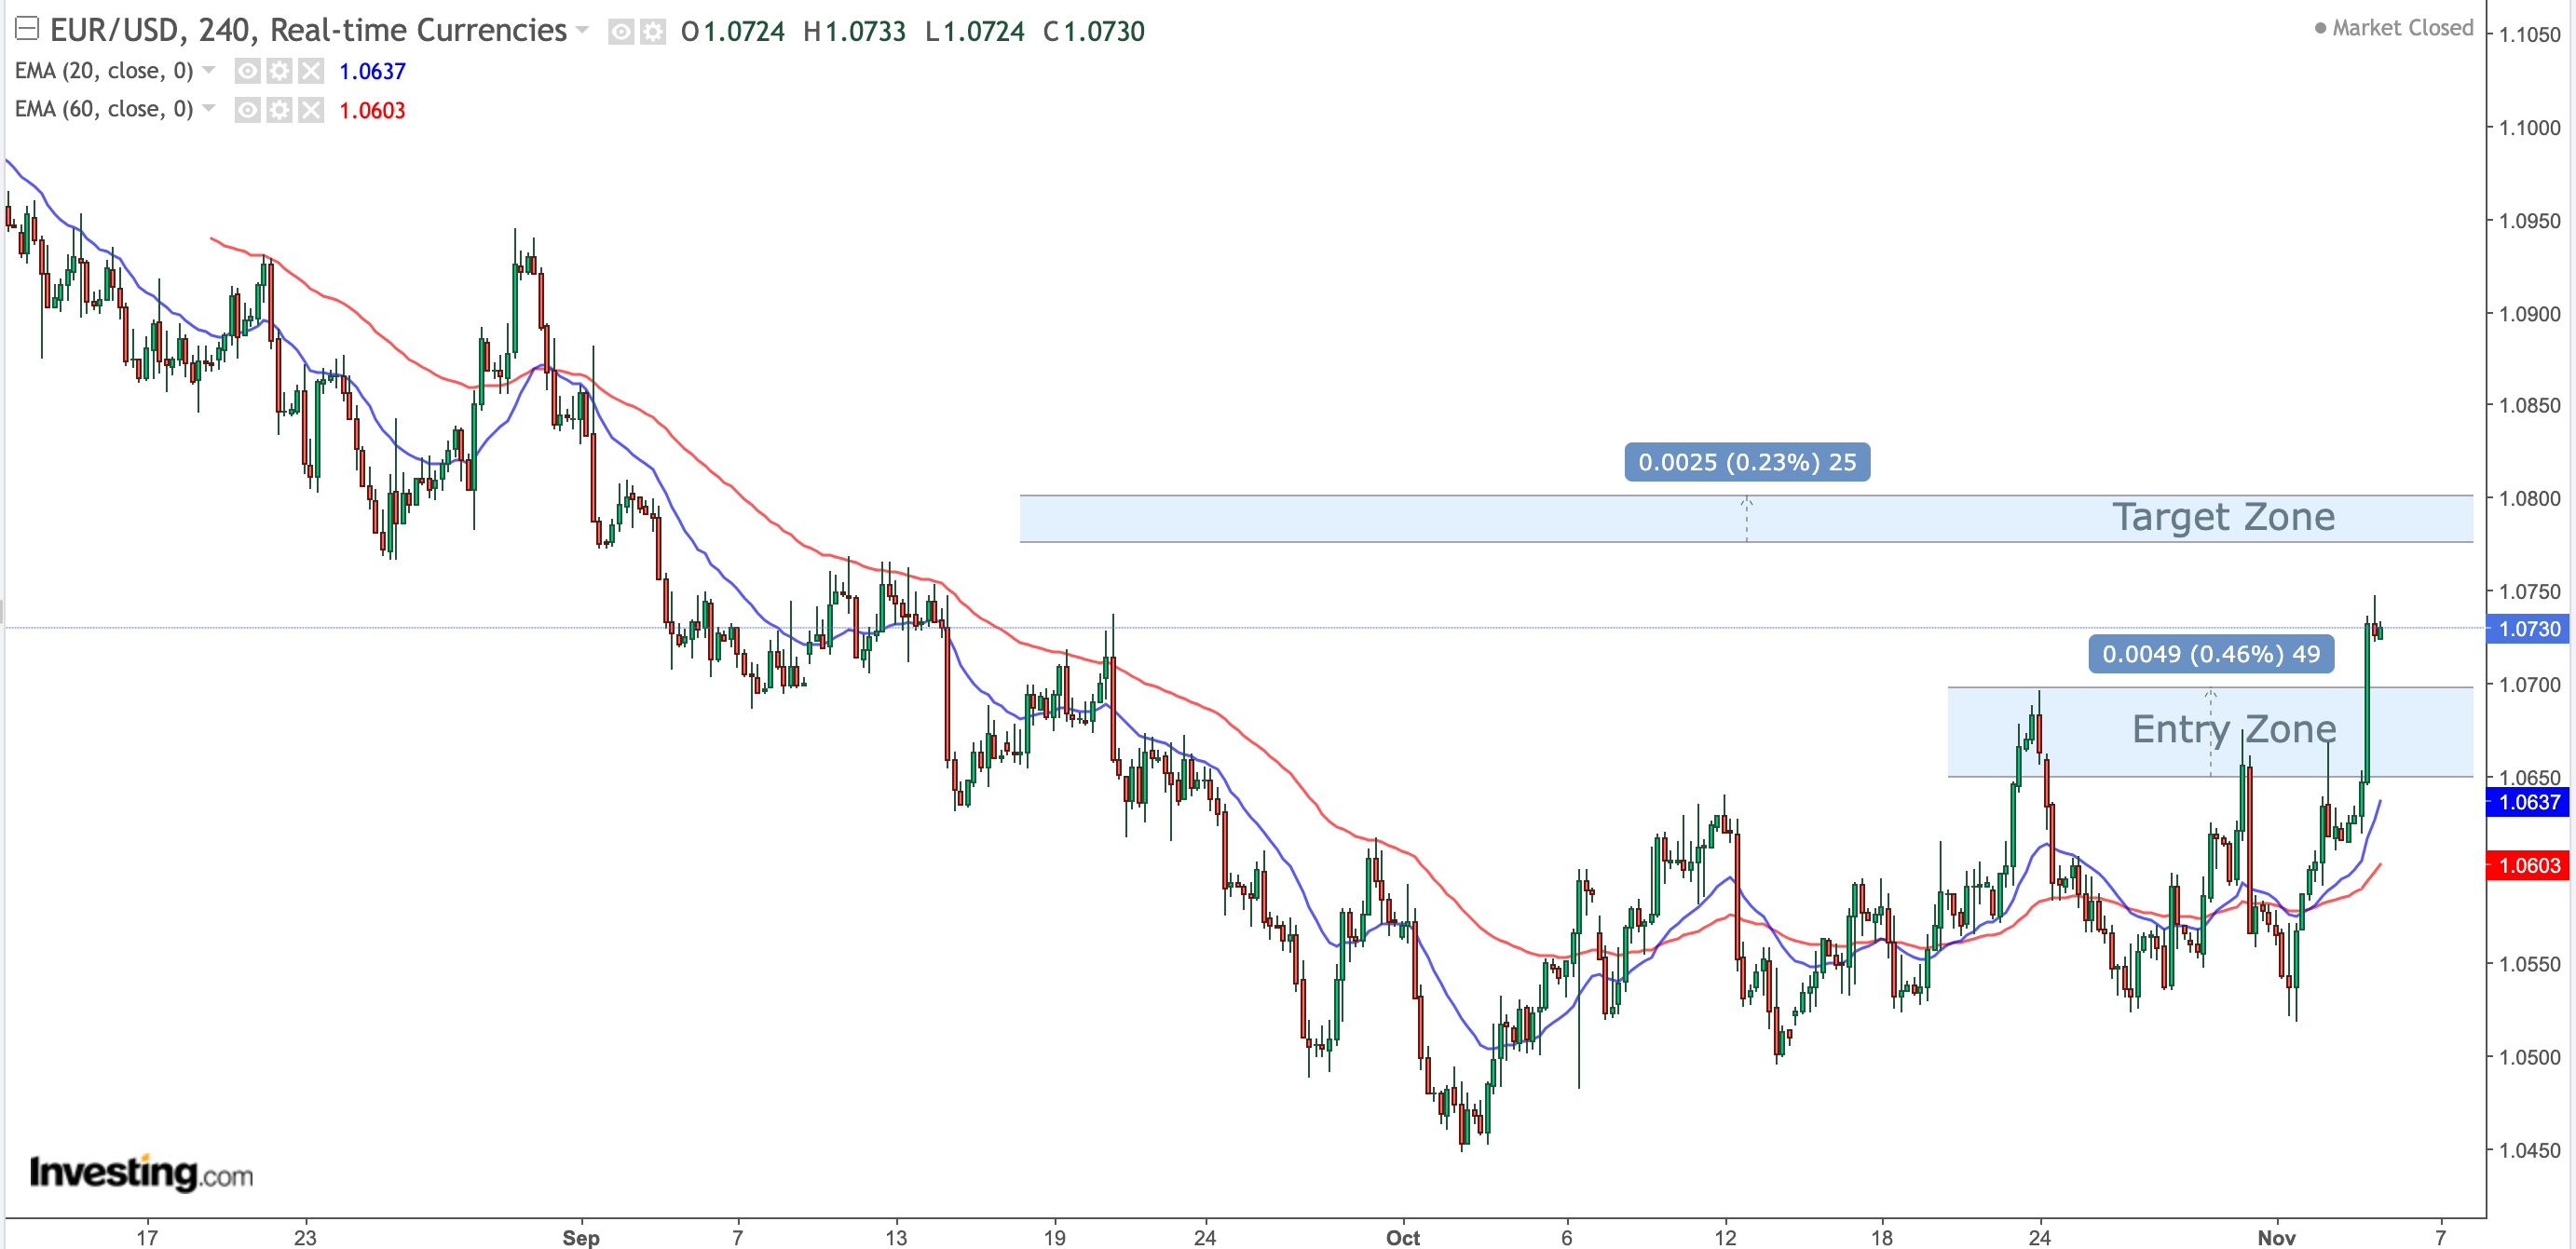
We look at the 4-hour chart for the EUR/USD, it seems there is a possibility for further upside for the week ahead.

We will be hunting for entries around the 1.065-1.07 region with a stop at 30 pips which is in line with the Average True Range. 

The hint of not only a pause in the hike of the Fed rate but a potential pivot has driven the surge in EUR/USD. They have successfully broken out of their consolidation range for the month of October.

Our target for EUR/USD for the week ahead will be 1.078-1.08 region.


USD/JPY Charting Analysis

USD/JPY chart

Source: Investing.com

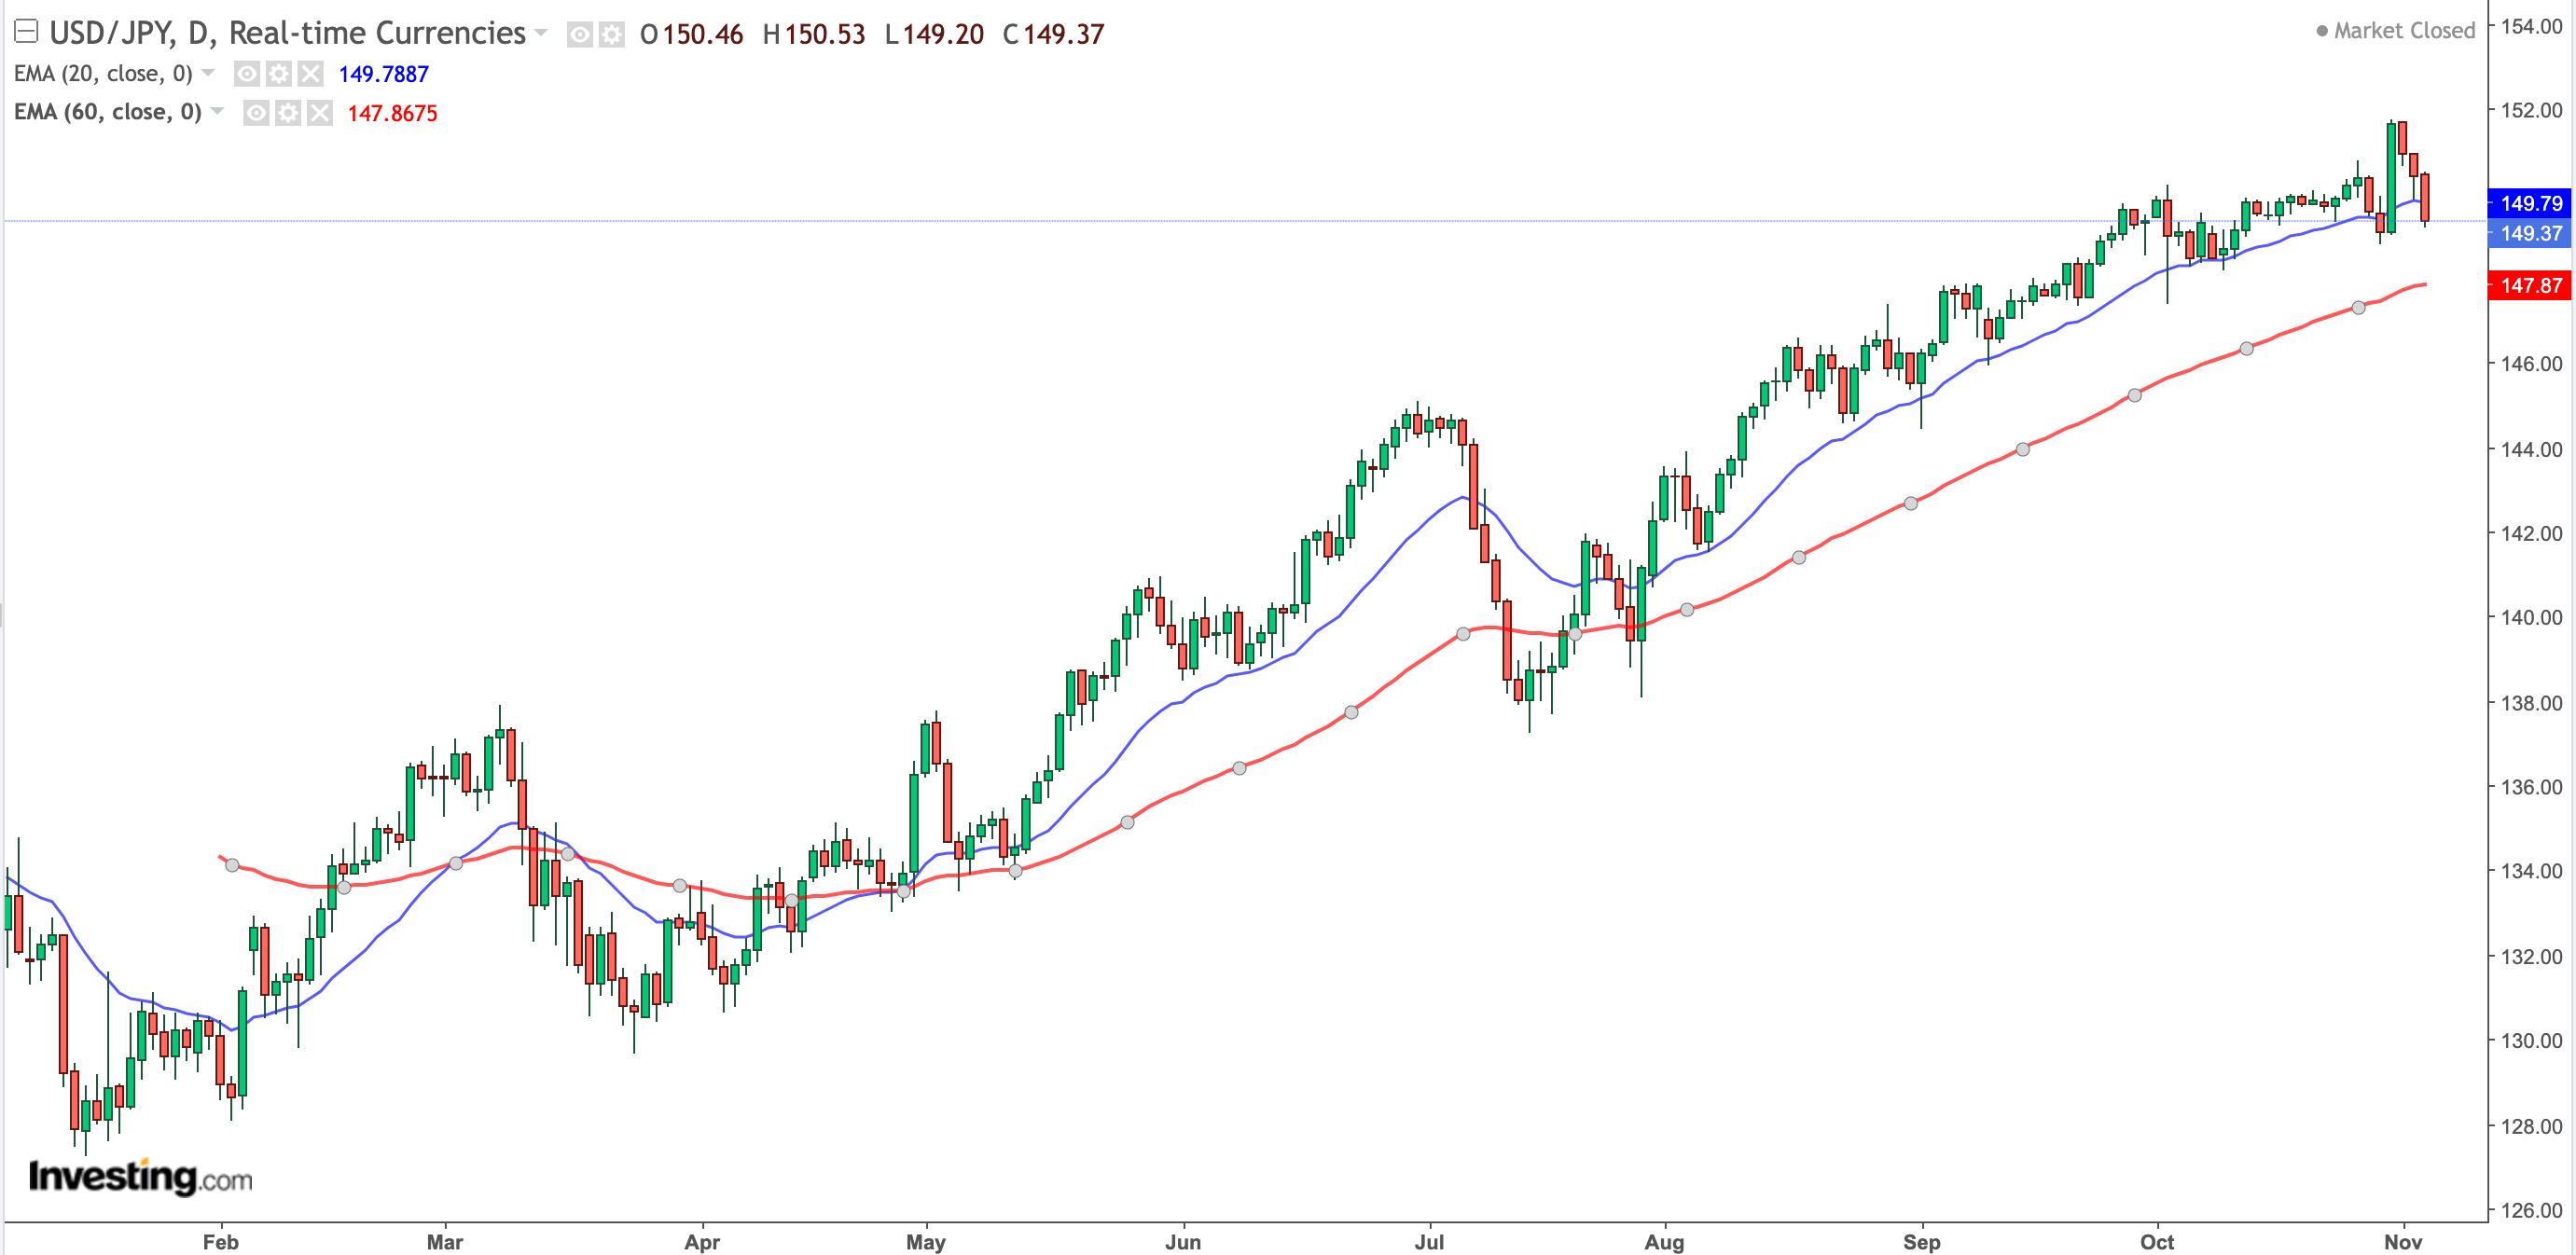
Our view of USD/JPY is that the uptrend is still intact. It is indeed a good time to be going to Japan for holidays given the weakness of the Yen. The last time Yen was this weak against the USD was in 1990.

As long as the 148 level holds, we will be looking to place trades on the long side. 

A reversal of the trend would need to see a convincing break below the 148 level.


We hope you found value in this article. Help us grow by sharing it through the social media icons below. Don’t forget to subscribe to our website for more insightful articles as soon as they’re published!


Disclaimer:

The content here is for informational purposes only and should NOT be taken as legal, business, tax, or investment advice. It does NOT constitute an offer or solicitation to purchase any investment or a recommendation to buy or sell a security. The content is not directed to any investor or potential investor and may not be used to evaluate or make any investment. Do note that this is not financial advice. If you are in doubt as to the action you should take, please consult your stockbroker or financial advisor.

Wednesday, 27 September 2023

Will Country Garden Collapse with their Debt Load?

Contributed By: The Big Fat Whale


Recent headlines from major publications such as Reuters, Bloomberg, CNA etc., have painted a bleak outlook for Country Garden. It seems to point that they would likely default on their debt which could potentially lead to a collapse of the whole company.

Country Garden was the largest real estate company in terms of sales in China last year. They generate 96% of their cashflows from real estate sales.

Headline numbers put them in debt of 196 billion US Dollars (1.4 trillion RMB). There have been also delays in the payment of interest on bonds and postponing the repayment of a key loan.

With the slowing of China's economy coupled with inflationary pressure on construction costs, it has been a tough time for China developers. Country Garden is also not in the most ideal target segment, 60% of their property projects are located in 3rd to 4th-tier cities.

This is the segment where prices have fallen the most and the target buyers have low purchasing power.

We decided to have a look at their financials to have a better sense of the situation. Before we move into the numbers, let's look at the background of Country Garden so we can paint a better narrative of their current predicament.


Background of Country Garden

Yang Guoqiang founded Country Garden in 1992 in Beijiao Town, Foshan City. He built the company from scratch, having previously worked as a farmer and on construction sites.

The company now has interests in property development, construction, fitting and decoration, property management, and hotel operations in a wide variety of global markets.

It was listed on the Stock Exchange of Hong Kong in 2007 with its annual sales exceeding RMB100 billion in 2013. The Company made it to the list of Fortune Global 500 for the first time in 2017.

In 2015, Chinese insurance giant Ping An became the second largest shareholder in Country Garden by acquiring 9.9% of the company for US$800 million.


Forest City Johor Bahru

China made up the bulk of their business with 3125 developments as compared to 31 overseas developments. But what we could relate to when we talk about Country Garden, will be their grandiose Forest City Project that is just across the Causeway in Johor Bahru, Malaysia.

Forest City is meant to be a US$ 100 billion dollars development that was hyped up to be a paradise with turtles and white-sand beaches. To date, only US$ 4.3 billion has been invested and housing less than 10,000 residents. It is a far cry from their 700,000 projection.


Click Here for the Full Article:

https://thebigfatwhale.com/country-garden-debt-load-collapse/

Wednesday, 20 September 2023

Is ARM IPO Overhyped?

Contributed by: The Big Fat Whale


It has been a while since an IPO has rocked the financial markets. The ARM IPO has been the highlight since its launch last week at the price of $51. At a PE of over 100, is it worth a look at or is it simply overhyped? Let's take a closer look.

Giving some backdrop, Softbank took ARM private in 2016 at a valuation of 32 billion US dollars. Based on their listing IPO price of $51, it gives it a valuation of $54.5 billion dollars. Softbank still owns 90% of the company after this share offering.

The demand has been overwhelming with the IPO shares being ten times oversubscribed but it could be due to only 10% of the company being up for grabs. The first day gain was around 25% with the price touching $64.


ARM Business Model

ARM was established in 1990, Arm began as a joint venture between Acorn Computers, Apple Computer, and VLSI Technology. ARM was publicly listed on the London Stock Exchange and the Nasdaq Stock Market from 1998 until 2016 when ARM was taken private by SoftBank Group, our controlling shareholder.

"Our open and flexible business model provides access to high-quality CPU products for a wide range of potential customer types and end markets. We license our products to semiconductor companies, OEMs, and other organizations to design their chips. Our customers license our products for a fee, which gives them access to our designs and enables them to create Arm-based chips. Once a chip has been designed and manufactured with our products, we receive a per-unit royalty on substantially all chips shipped. The royalty has typically been based on a percentage of the ASP of the chip or a fixed fee per unit, and it typically increases as more Arm products are included in the chip. Our business model enables the widest range of customers to access Arm products through an agreement best suited to their particular business needs"

Source: ARM IPO Prospectus

Think of ARM as the architect or designer behind the brain of your smartphone or tablet. They create the blueprint for a type of computer chip called a "processor." This processor is like the brain of your device, handling all the calculations and tasks it needs to perform.

ARM doesn't actually make the physical chips; instead, they license their designs to other companies (like Apple, Samsung, or Qualcomm) who then manufacture the actual chips based on ARM's designs. So they will earn licensing fees for each chip that was produced.

ARM is constantly compared to Nvidia as the two forefront stocks to benefit immensely from the development of the Artificial Intelligence Industry. From what we have read, ARM is more focused on the Central Processing Unit (CPU) whereas Nvidia is focused more on the Graphic Processing Units.

Here are the differences between the two products:

  • CPU: CPUs are essential for general computing tasks, running operating systems, office applications, and tasks that require precise calculations and control. They are the primary computing component in most computers.
  • GPU: GPUs are essential for graphics-intensive applications, including gaming, video editing, 3D modelling, and scientific simulations. They are also increasingly used for AI and machine learning tasks due to their parallel processing capabilities.

In summary, while both the CPU and GPU are vital components of a computer, they serve different purposes and excel in specific types of tasks. CPUs are versatile and handle general computing tasks, while GPUs are specialized for graphics processing and parallel computing tasks. Many modern computers and devices use both CPUs and GPUs to optimize performance and efficiency for a wide range of applications.

A Publication By The Big Fat Whale


Click Here for the Full Article:

https://thebigfatwhale.com/arm-ipo-overhyped/

Thursday, 2 June 2022

Food Crisis and Protectionism- Boom for the Cold Storage Industry


Contributed by: The Big Fat Whale

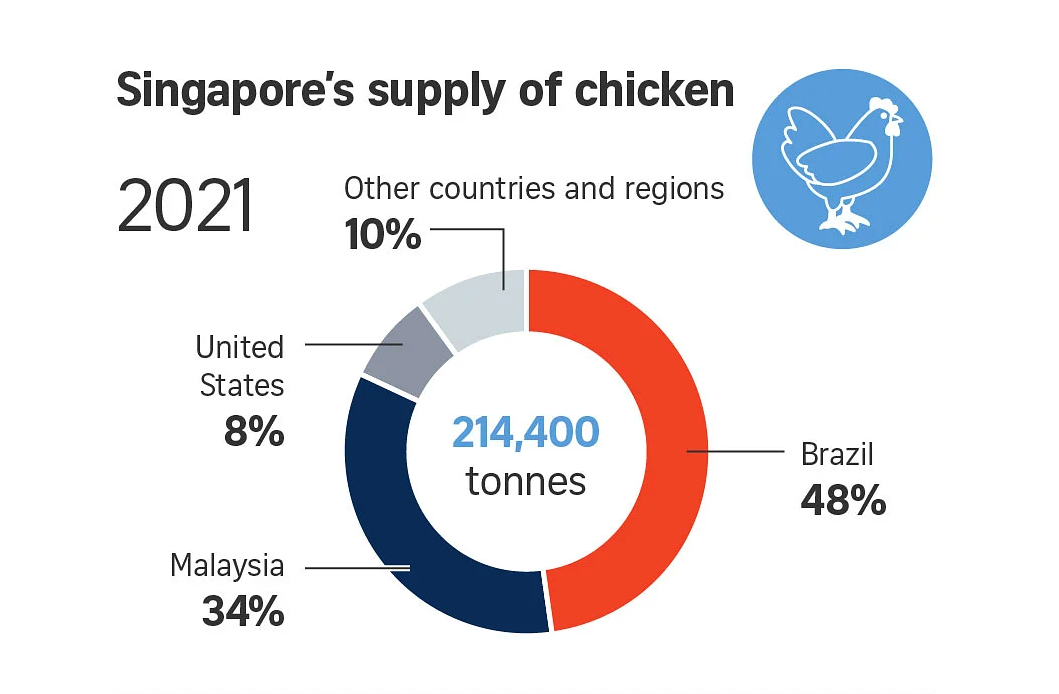
The recent ban on exporting live chickens- 3.6 million a month- from Malaysia to Singapore has been unprecedented. It shows the vulnerabilities of the supply chain issues for a country like Singapore which is highly dependent on others for their food and energy sources.

The current situation is due to the cap by the Malaysian government on chicken prices at RM8.90 per kg since Feb 5, 2022, which has led to losses or minuscule margins for the chicken breeders. This has affected the supply of chickens as some would rather not breed given a loss-making situation where costs of breeding have shot up due to the world's inflationary environment.

The government did try to cushion and provided support to the breeders through a subsidy of RM730 million. However, to date, only RM50 million have been paid out.

The ban on Malaysia's export to Singapore could help stabilise the prices of chickens in Malaysia as there is a good possibility that prices the breeders managed to secure from Singapore would be higher than the ceiling price set by the Malaysian government.

However, if prices are not set by market forces, sustainability would be questionable, especially with subsidies not efficiently handed out.

Singapore Chicken Source

Source: The Straits Time

From the chart above, Malaysia should form the bulk of our live chicken supply due to the geographical and logistical aspects of the supply chain. 

Going forward, with a huge dent in the supply of live chicken stocks, we might have to make do with frozen chicken till the ban eases.


Click Here for the Full Article:

https://thebigfatwhale.com/food-crisis-and-protectionism-boom-for-the-cold-storage-industry/ 

Friday, 13 May 2022

When to Sell Your Stocks?- Return Trip is Terrible

Contributed by: The Big Fat Whale


The bloodshed in the markets especially in the growth and technology sector has made some investors' saneness go overblown, it would further exacerbate the situation if they are on financing or borrowed funds.

As the saying goes:

"The Market moves up like climbing the stairs but comes down in an escalator"

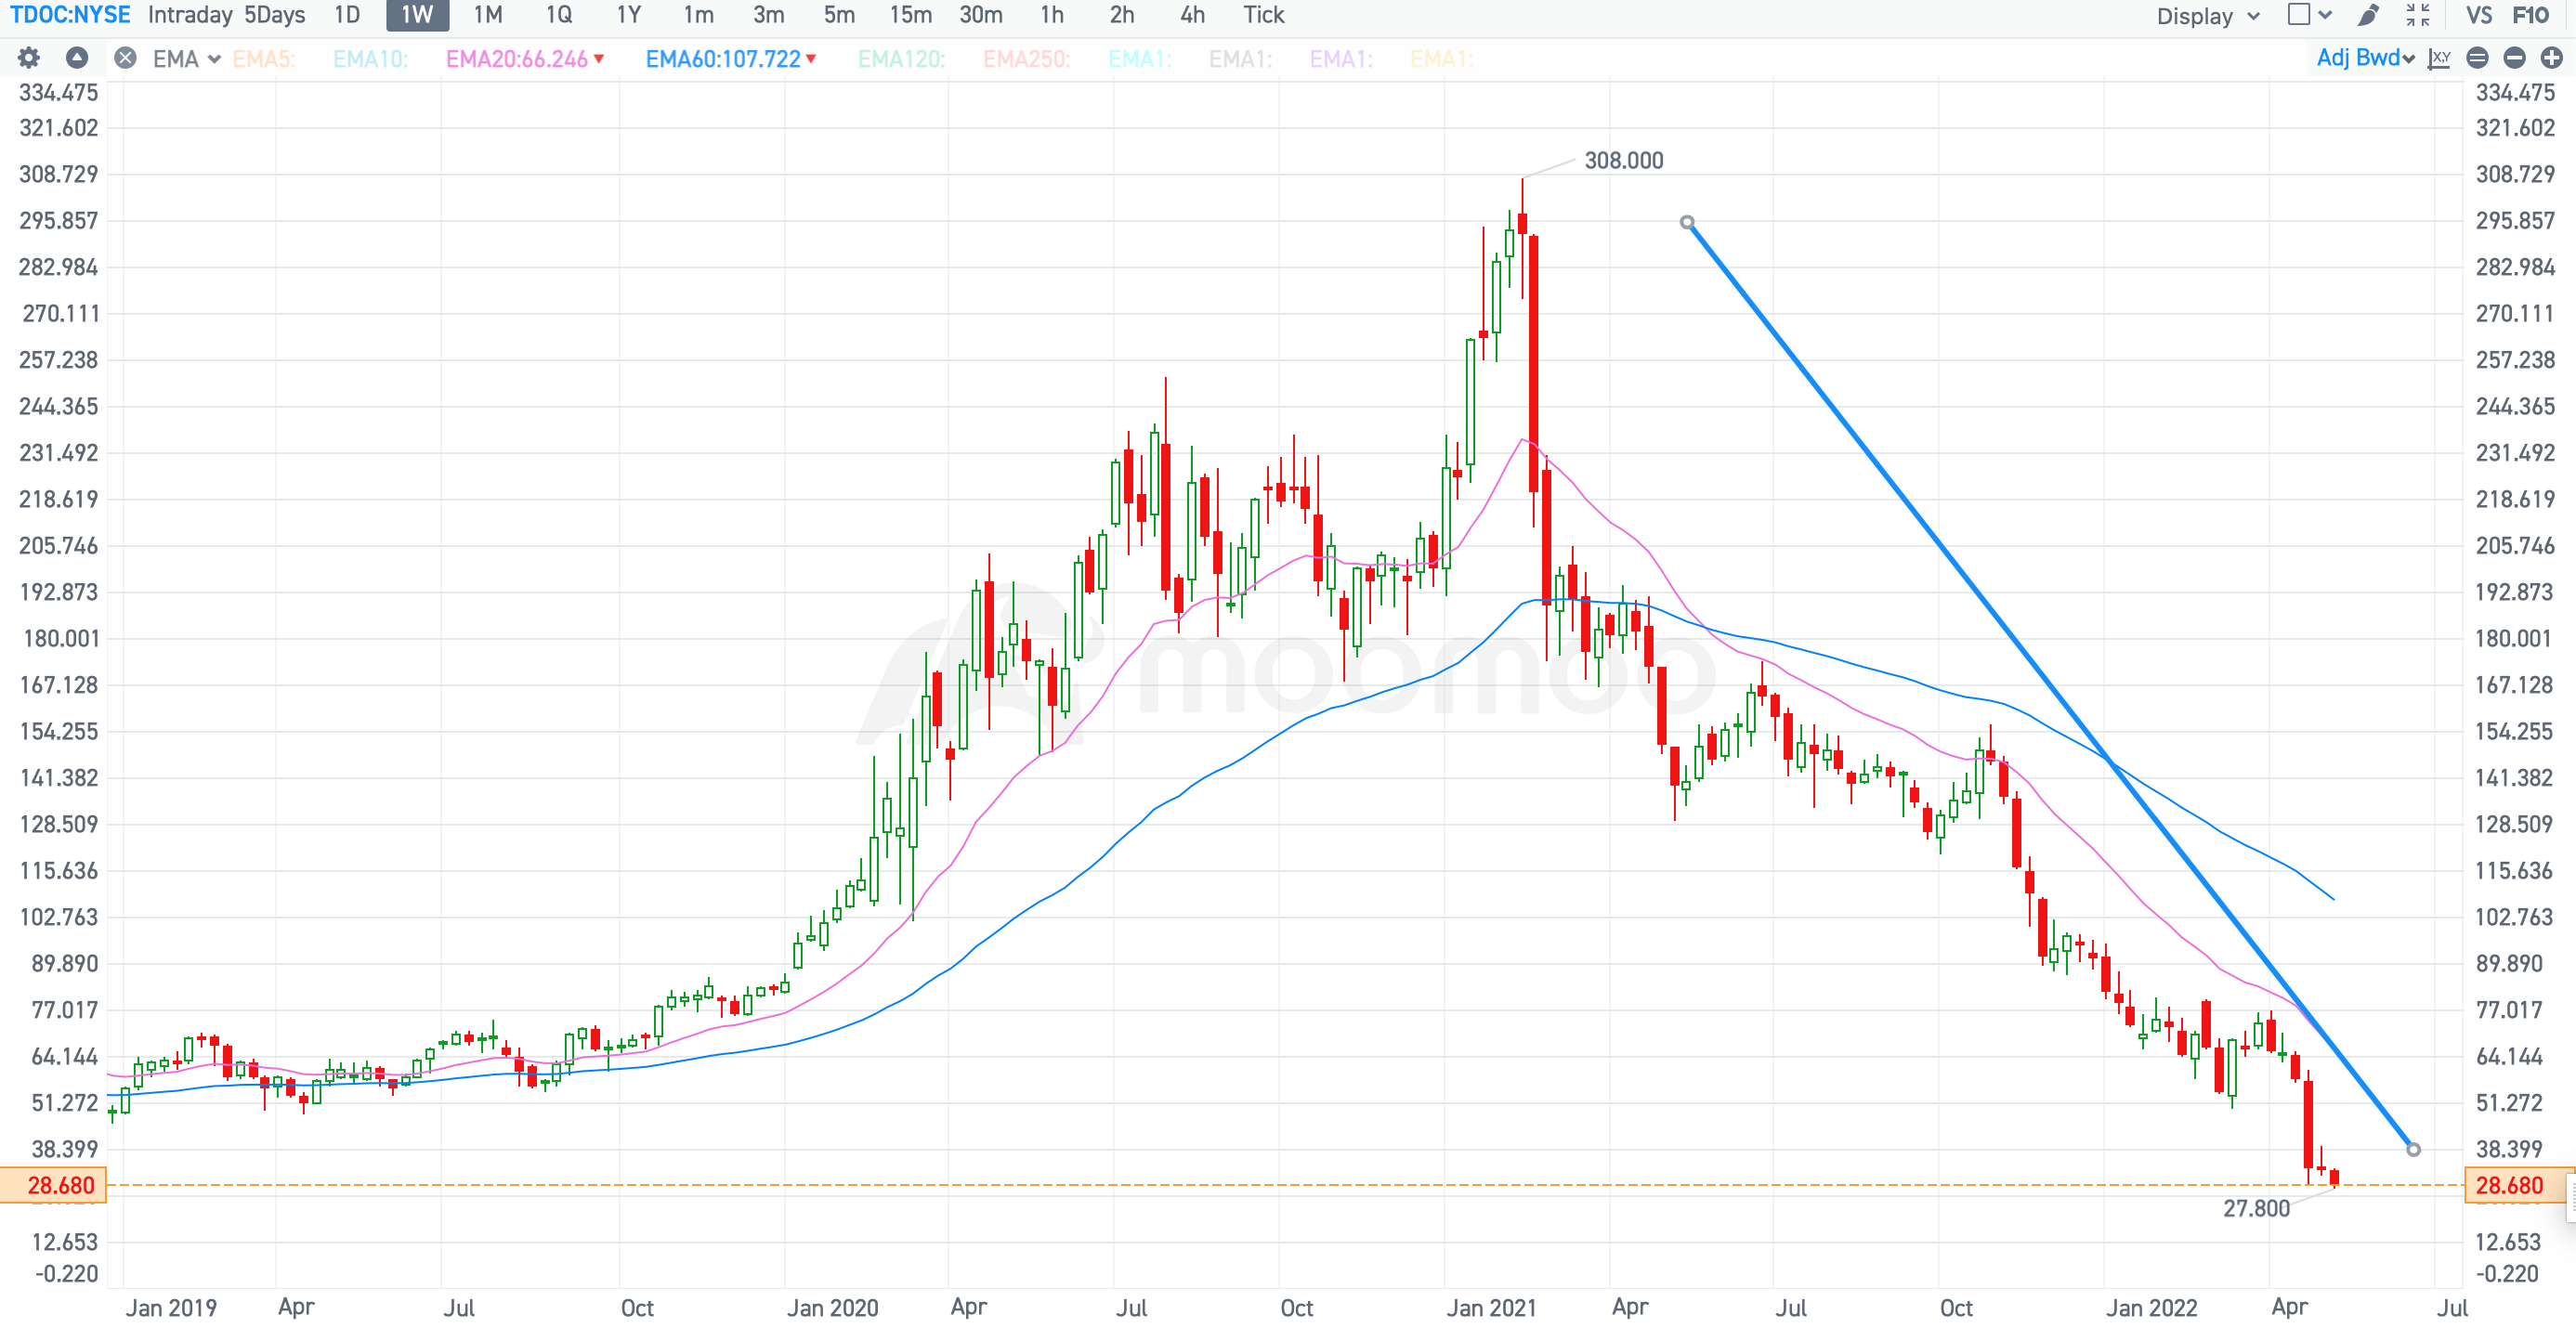
Some of the stocks have done a return trip which is giving back all the great gains and even worse, you are underwater and in deficit. A good example will be one of Ark Investment's favourite stocks, Teladoc.

The feeling of letting go of a 3-4 bagger gain and making a loss is a terribly tough situation to handle emotionally.


Click here for the Full Article:

Saturday, 30 April 2022

Recession Oncoming- Forecasted by the Inverted Yield Curve

Contributed by: The Big Fat Whale

If the financial markets have a crystal ball, it would be everyone's dream to grab hold of it.

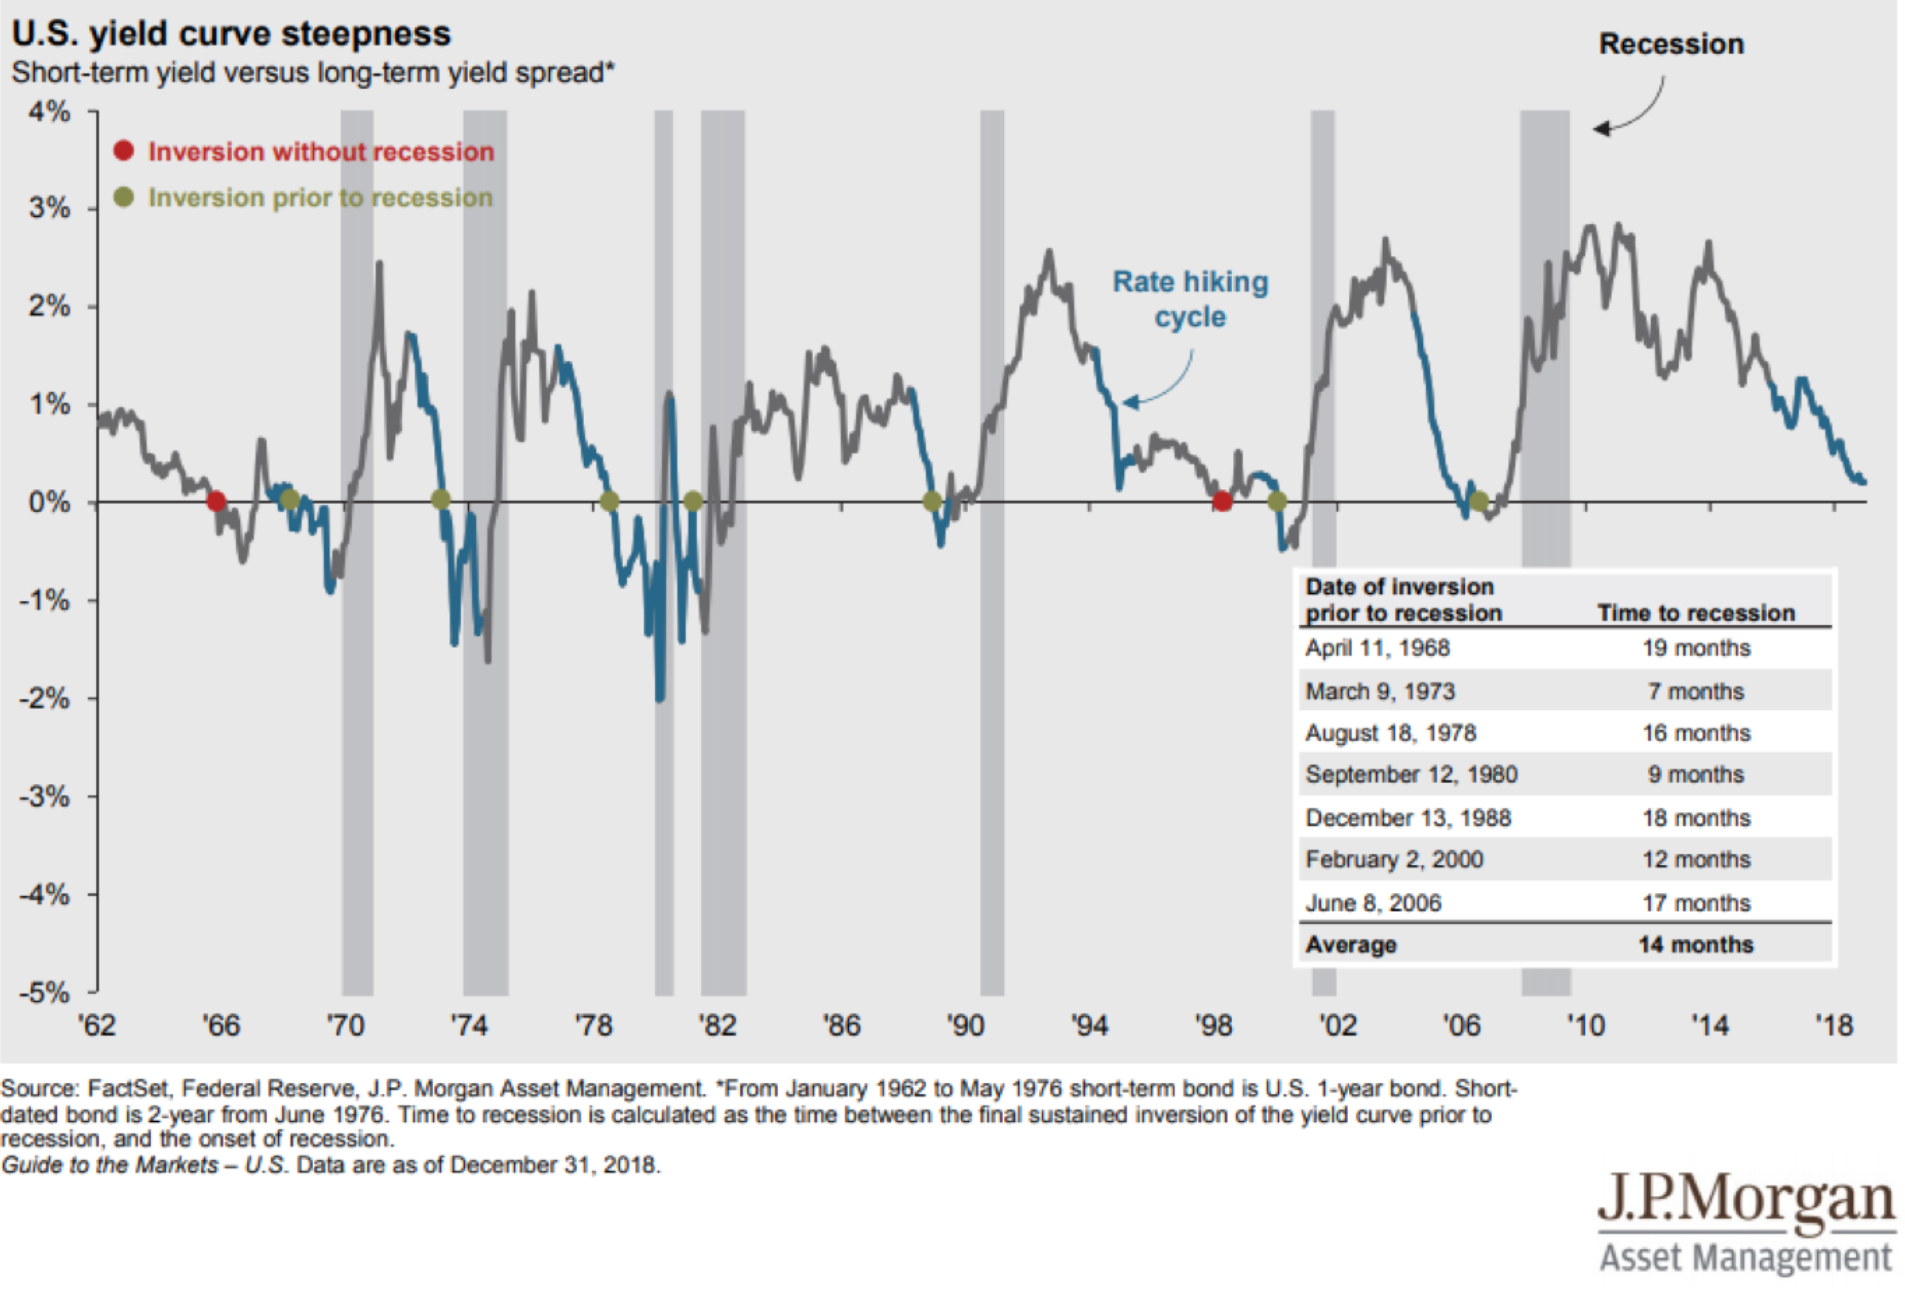
Today, we are going to share with you, an indicator that has successfully preceded a recession since 1955 except for once in the mid-1960s. There was an economic slowdown rather than a recession but the forecasting prowess should not be undermined.

Uncannily, the latest inversion was in 2019 that preceded the market crash caused by Covid 19 in March 2020.


Inverted yield Curve

Source: JP Morgan Asset Management - For the 2020 recession in April, it took 8 months to recession after the inversion.


On April 1st 2022, the 2 years and 10 years of US Treasuries rate saw an inversion again. It would be foolish to ignore it given their track record of predicting a recession and economic slowdown.


Click Here for the Full Article:

https://thebigfatwhale.com/recession-oncoming-forecasted-by-the-inverted-yield-curve/ 


Tuesday, 15 March 2022

How to Invest in a Bear Market? - Advice from a Veteran Fund Manager with 54 years of Experience


If you are heavily invested in China Tech, it is not an easy time in the past few weeks. Baba has fallen by 30% within a week and the end seems not in sight. Even the almighty Tencent was not spared from this perfect storm.

The reasons for their drop could be from the possible implications of delisting from the US, China's regulatory claw and the more likely cause which is similar sanctions imposed on Russia slapped on the Chinese companies.

Would the US and its allies impose drastic sanctions on China? Based on a realistic assessment, it is unlikely to happen as China is playing the neutral role well so far. However, it was also unlikely too for Russia to wage a war on Ukraine without negotiations so it is anyone's guess in this crazy world.

It has been a long while since I saw HSI testing 18000 levels, the way it is going, it looks like they are going into bankruptcy administration. Many of the companies are currently trading close to value stocks status despite their growth characteristics. Tencent at PE of 12 and Baba at PE of 11 (excluding one-off writing down of goodwill).

The Chinese Government have to step in soon unless they want to have a crumpled capital market which will not be in line with their goal of China being strong, independent and vibrant. Statements to provide support for the Chinese market would be most welcome in such dire conditions.


They have shown their prowess and proven their point that no one is on top of the powerful government. Jack Ma is nothing but just a cloud in the sky. Is it perhaps time to spare the rod and shower some care and concern?

The merits of being able to do valuation of a company based on financials rather than concepts would come in useful at this juncture. If we are convinced China would not let their titans fall, this is the time to be brave and accumulate the "best of the class stocks" in China.  

The Graham crowd would be excited to hunt for gems in this current massacre of China's market where Mr Market is getting moody and throwing bargains at us. Even strong names like Ping An is not spared this time around.

Here is some advice from a veteran portfolio manager with 54 years of experience from Royce Investment Partners as he gives his input on how to invest in a bear market. I hope you will find it useful to navigate the current challenging conditions.


What’s your take on the sharp market decline?

I think it was overdue and I believe we have more to go. The reason that I think more drawdowns and declines are likely is the Fed has yet to implement the measures they need to take to restrain and hopefully bring down inflation.

I feel that they’re dramatically behind the curve, meaning that they have to catch up to do. They should have been removing stimulus and should have been raising rates earlier. They haven’t done so. And that’s ahead of us.

Do you think there are other parallels in your career?

I’ve been doing this professionally for 54 years, which means I was actually a young portfolio manager managing a pension fund in 1972-75, also known as the Nifty Fifty era. And this was at a time when, much like the FANG stocks of today, there was an anointed group that sold at very high valuations. We’ve obviously seen this in the dot.com bubble. It repeats itself. So history is a good instructor in these matters.

And the market, from top to bottom, went down 50%. That insight that I learned then was instilled in me by a veteran trader. And he says to me, Charlie, hold your horses. This is the beginning of a bear market. What you’ve got to do is you’ve got to pace your purchases, dollar cost average. You don’t know how long this is going to take.

So what I learned then was a pyramid. What you do is you buy, think of the top of the pyramid, you buy a little. And as the price declines, you buy more. And on days that market goes up, you stop buying, on the presumption, it’s going to go down tomorrow or the day after.


Here is the link for the Full Article:

https://www.royceinvest.com/insights/2022/1Q22/how-a-veteran-pm-invests-in-bear-markets

Monday, 14 March 2022

Navigating the Investment Landscape in a Stagflation World- Revisiting the 1970s

Contributed By: The Big Fat Whale

Stagflation is the buzzword in recent times. The definition of stagflation will be persistent high inflation combined with high unemployment and stagnant growth in a country's economy.

The most relatable period in which we can have insights into the impact of stagflation would be a relook into the 1960s-1970s period. This was the only time in modern history(20th and 21st century) that this economic phenomenon has happened.

Inflation was persistently above the 8% mark throughout the period from 1972 to 1981.


History Rhymes

As Mark Twain famously quoted:

"History does not repeat itself but it certainly rhymes"

There are many market analysts and commentators that dismissed the possibility of stagflation happening and argue that the situation is different this time. One of the main arguments is that stagflation is caused by the oil shock in the 1970s which send oil prices spiralling up and the US was heavily dependent on it.

Currently, the US is a net exporter of oil as they have the largest shale oil reserve in the world and with the advent of alternatives (Solar, Wind and Nuclear), the impact of oil on the economy would be less pronounced.

But we might not have an oil shock but a debt shock could be on the cards which have been built up from trigger happy Quantitative Easing in the past. Debt to GDP is at a record of 124% versus 35% in the 1970s.


Click Here for the Full Article: 

https://thebigfatwhale.com/navigating-the-investment-landscape-in-a-stagflation-world-revisiting-the-1970s/

Tuesday, 22 February 2022

Russia War with Ukraine- Brinkmanship or For Real?

Contributed by: The Big Fat Whale

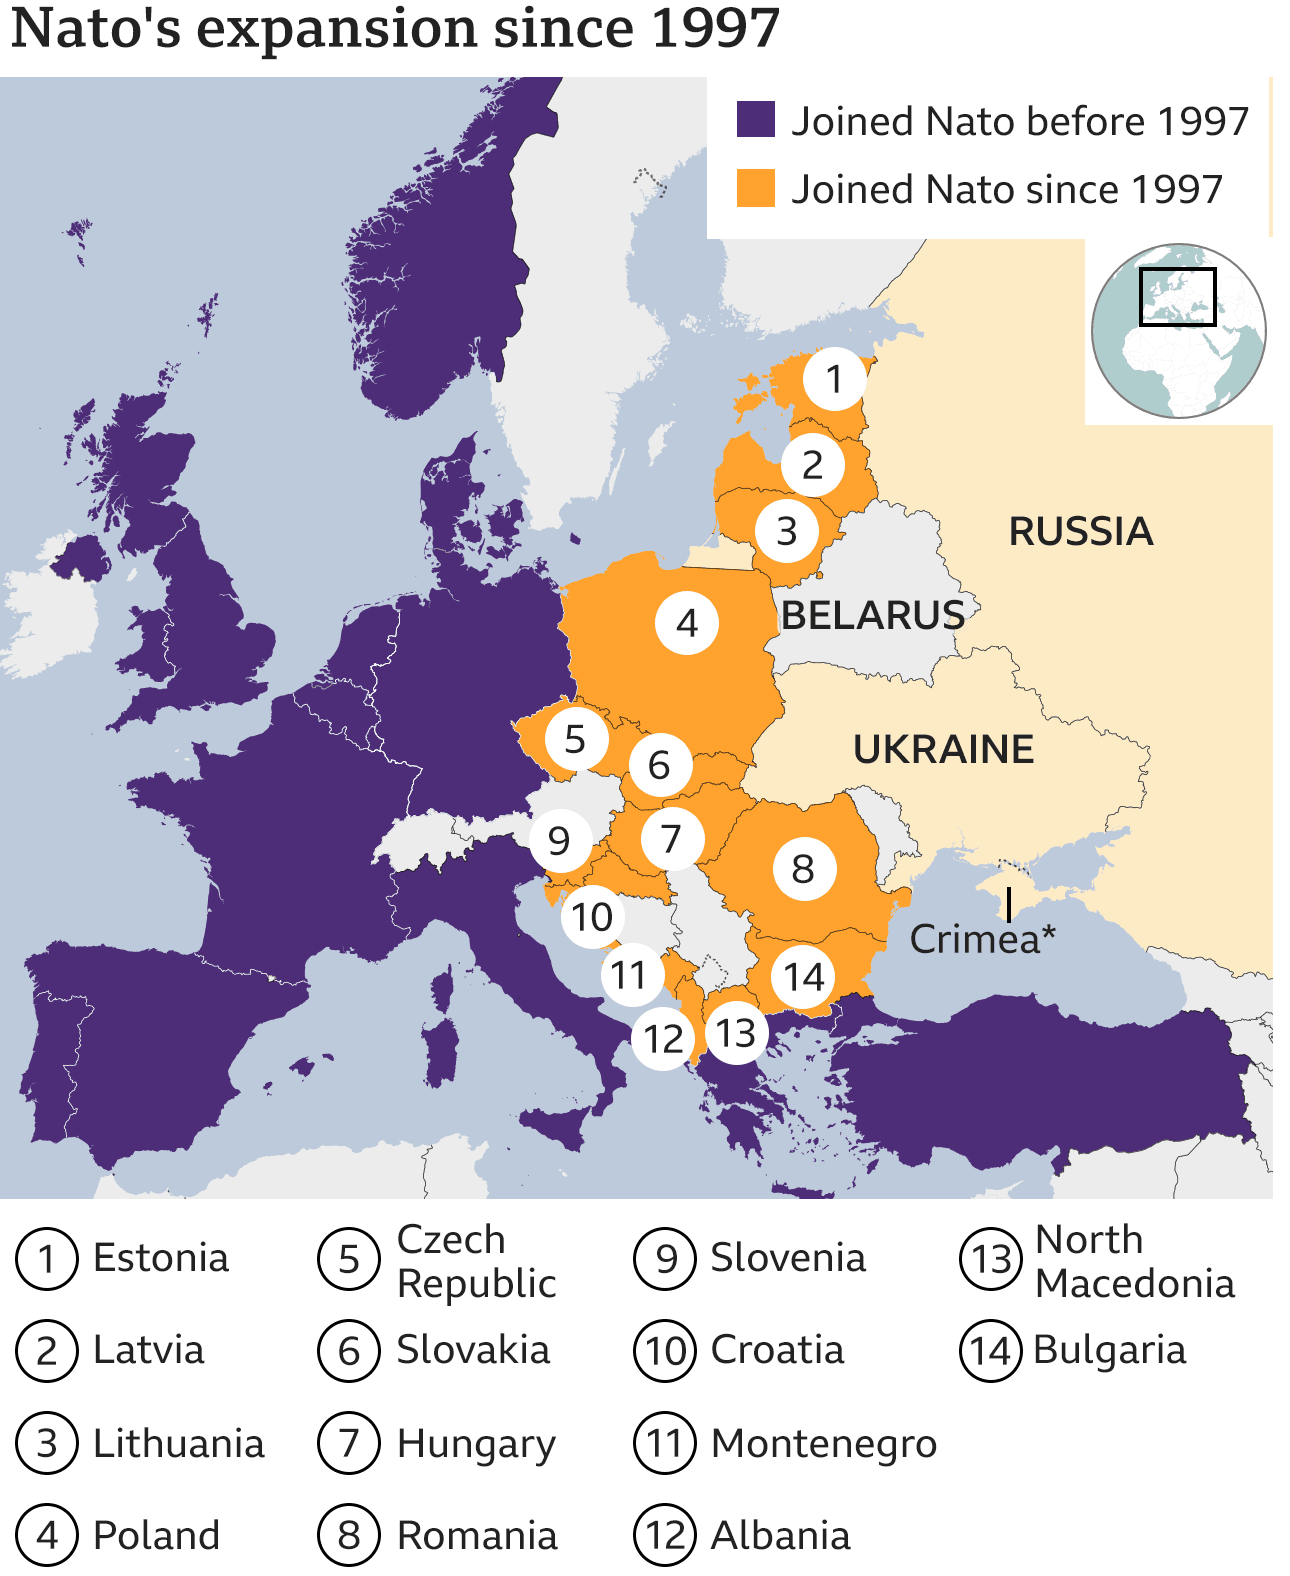
With the latest developments looming around the Russian and Ukraine region, where there have been other players such as the US adding fuel by giving intelligence that Russia is going to wage war in a matter of days. 

So is Russia really bent on taking over Ukraine?

Source: BBC


What is Happening?

The threat is real with more than 150000 troops stationed near Ukraine borders. Adding some perspective, there was just close to 5000 troops deployed in 2014 when they seized Crimea from Ukraine.

Understandably, Crimea is much way smaller than the whole of Ukraine. The seizure could be a strategic move given the geographical location of Crimea as could be seen from the map.

Click Here for the Full Article:

https://thebigfatwhale.com/russia-war-with-ukraine-brinkmanship-or-for-real/

Friday, 28 January 2022

ETF to bet against Cathie Woods ARKK- SARK

Contributed by: The Big Fat Whale


Sick of Innovation Stocks that are just hyped up based on concepts with no sight of profits?

There is now an ETF to short against the stocks in ARK Innovation Fund helmed by Cathie Woods.

As Buffet famously quoted: 

Only when the tide goes out do you discover who’s been swimming naked.

With the easing of monetary policy and access to liquidity drying up, most of the innovation and concept stocks with no cash flow to speak of to sustain their business would be facing a liquidity crunch.

Here is the link for the full article:

https://thebigfatwhale.com/etf-to-bet-against-cathie-woods-arkk-sark/


Thursday, 6 January 2022

The Future of Medical Care- Teladoc

Contributed by: The Big Fat Whale


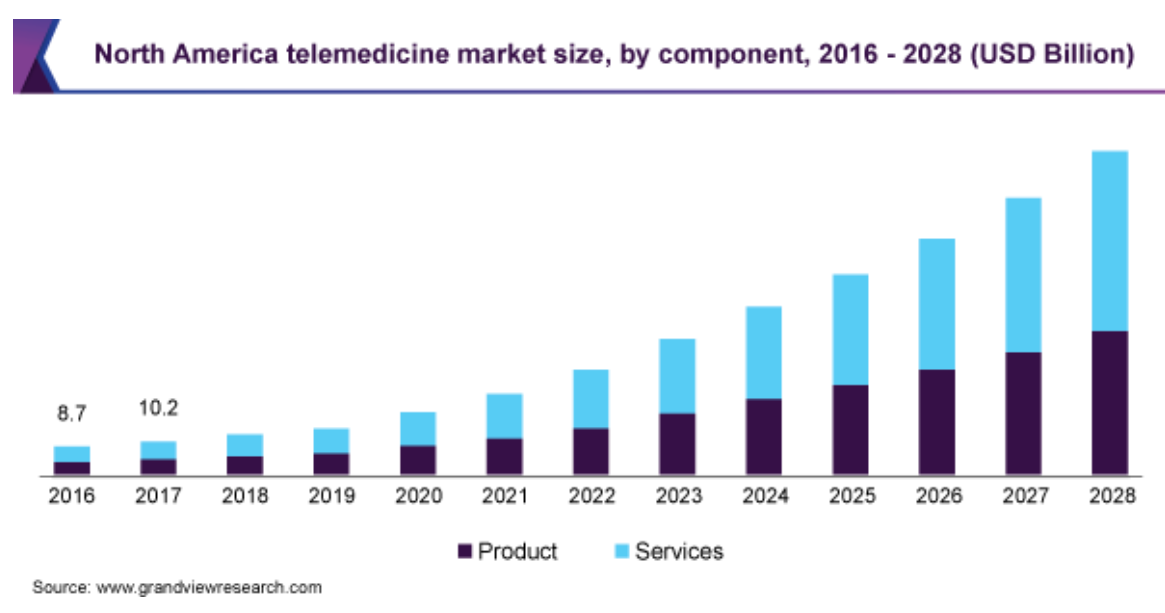
The telehealth market is one of the most glaring in terms of growth potential that surfaced during the recent pandemic. It is coming in from a low base initially and with Covid 19 in full force, it has triggered the adoption in huge strides. The regulatory issues were also quickly expedited for a smooth transition as quarantine became a norm for many.


Source: www.grandviewresearch.com


From the estimates by Grandview Research, the total market potential could reach 300 billion dollars in 2028, which gives us a compounded return of 22.4%- it is a good run-way of consistent and viable growth.  That is just the North American region.

These estimates are also backed by Mckinsey forecast for a 250 billion dollars telehealth market- a 20% share of the total medical market.


Strong continued uptake, favourable consumer perception, and tangible investment into this space are all contributing to the continued growth of telehealth in 2021. New analysis indicates telehealth use has increased 38X from the pre-COVID-19 baseline.

Source: Mckinsey


Here is the link to the full article:

https://thebigfatwhale.com/the-future-of-medical-care-teladoc/ 


Monday, 27 December 2021

6 Indicators to Gauge if S&P 500 is Peaking

Contributed By: The Big Fat Whale

The market has been on a tear ever since its huge 35% correction in March 2020- S&P index drop from 3400 to 2200- due to the Covid 19 pandemic. It has more than doubled from the bottom to its current level at 4650. 

So what's the outlook ahead?

Is it on a never-ending trajectory to the moon?

We will be looking at 6 indicators and the chart of S&P to give us some indication if things are getting way too hot that will lead to the imminent meltdown.

The power of the Fed printing machine has worked wonders. But is the market getting too complacent?


Buffet Indicator


Buffet Indicator

Source: www.currentmarketvaluation.com

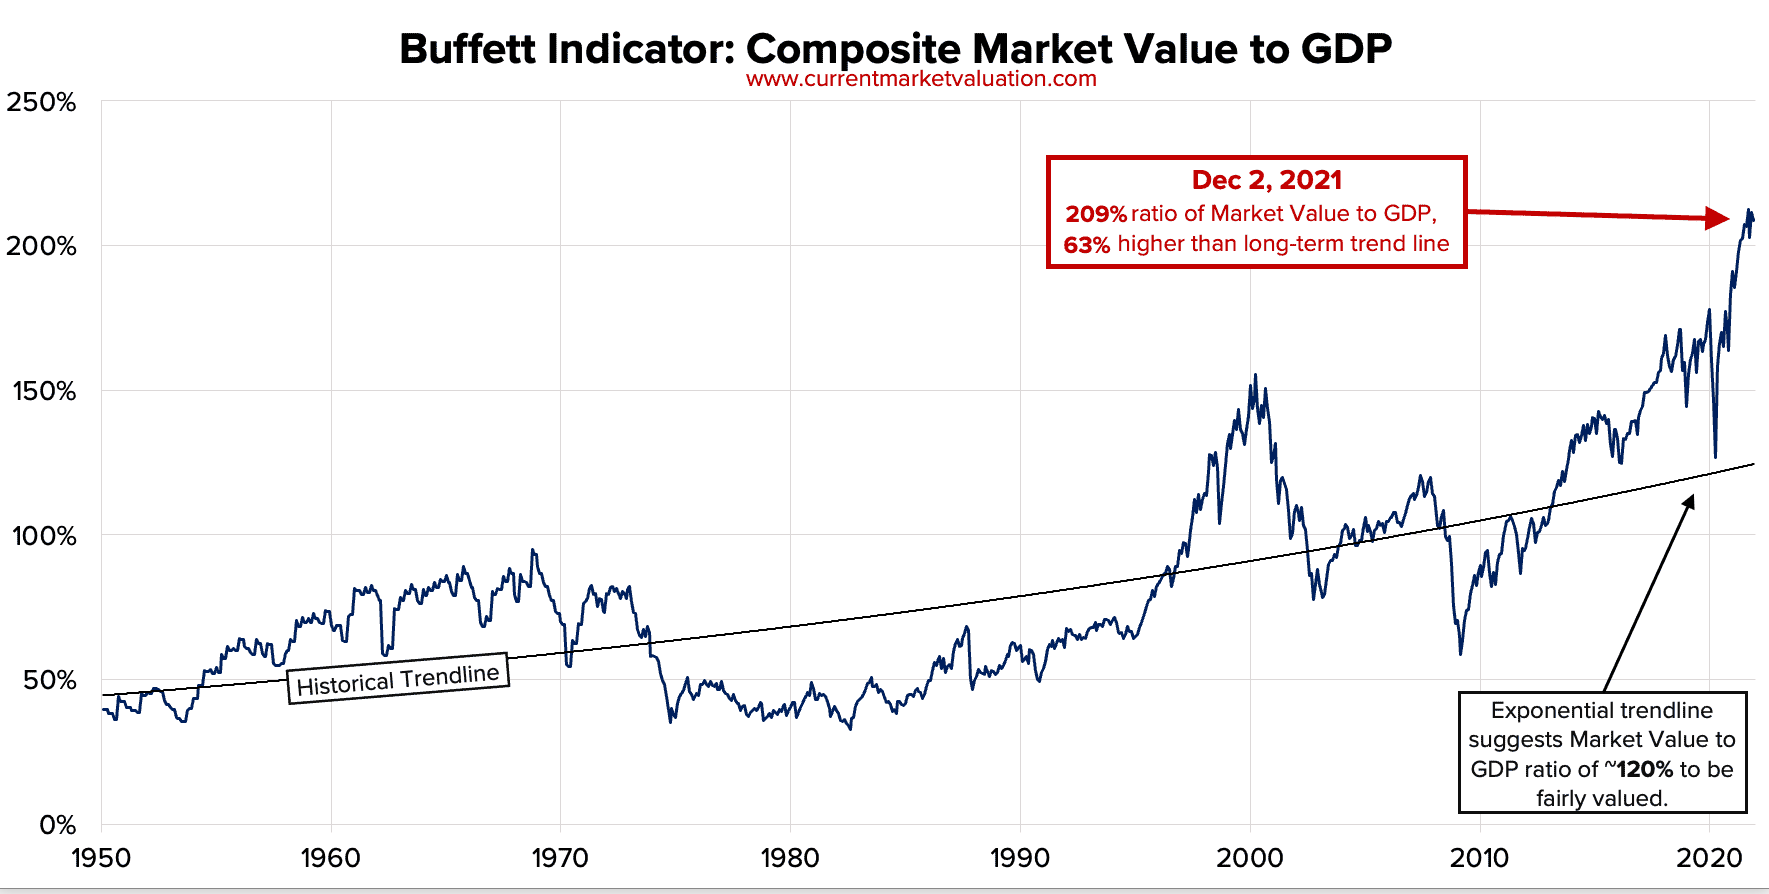
The Buffett Indicator is defined as the value of a country's publicly traded stocks divided by its gross national product. The greatest investor of our lifetime, Warren Buffet, have used this indicator to assist him to gauge where the valuation of the market stands at any moment in time. 

We are now way off the charts and looks excessively overvalued. If the market just reverts to the historical trendline, it could easily be a 50% correction


Click Here to Read More:

https://thebigfatwhale.com/a-look-into-6-indicators-to-gauge-if-the-market-is-peaking/ 

Saturday, 25 December 2021

Fed's Latest Move- Demise of ARKK and Innovation Stocks?

Contributed by: TheBigFatWhale


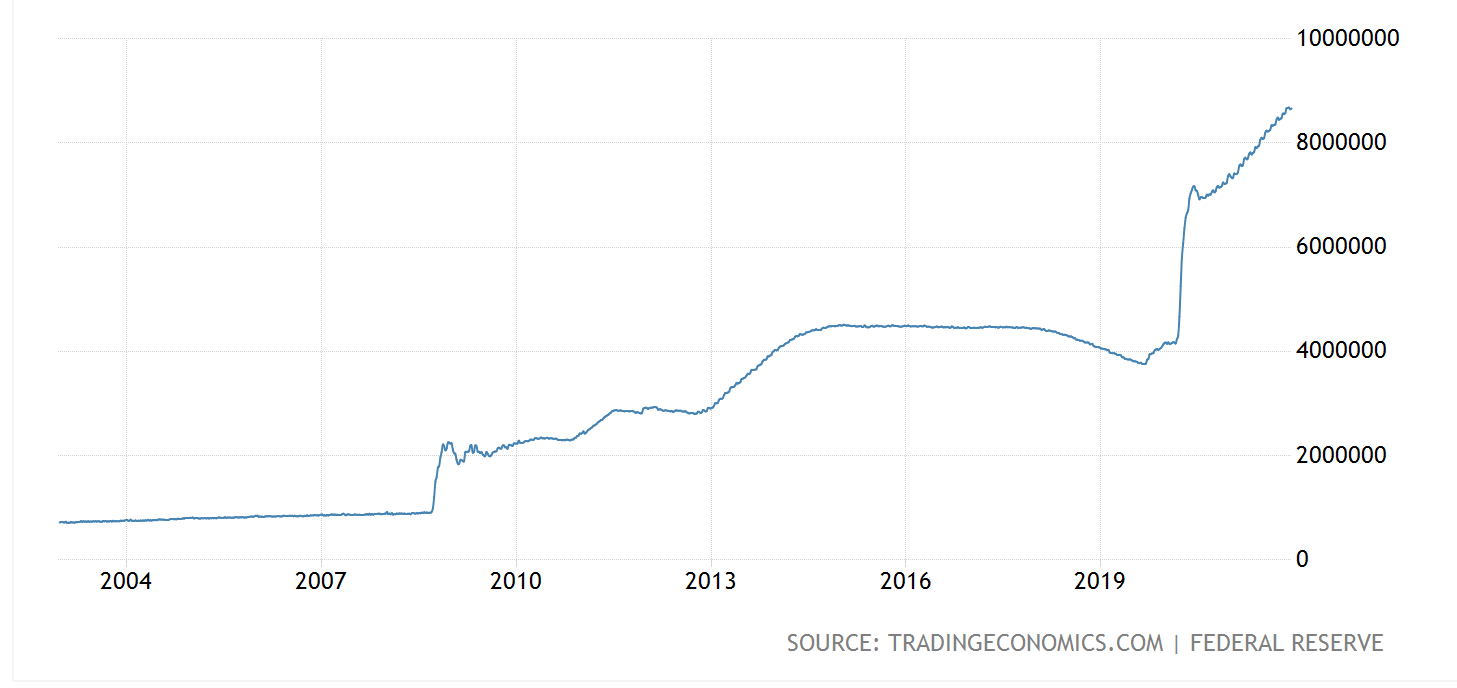
With the latest move by the Fed, where they are looking to have 3 interest rate hikes in 2022 and into reducing their balance sheet, growth stocks have not been faring well. The move by Fed is a move towards a monetary tightening policy that will drain the exodus of liquidity that has been pumped into the economy since early 2020. 


Fed Balance Sheet

Source: Tradingeconomics.com- Fed Balance Sheet


The Fed Balance sheet has more than doubled since 2020 which is a worrying sign that things are going out of control. Therefore, the indication by Fed to reduce their balance sheet is a sound and prudent move provided they are really serious about doing it. We touch on our previous article about the 6 indicators to gauge if the S&P 500 is peaking with the Fed Balance sheet as one of our concerns.

With a potential stoppage of easy money, the prospects for growth stocks could be bleak. Most of the growth or innovation stocks run on the theory that they would be wildly profitable once they are able to scale. Moreover, it is the vision for the future and it will disrupt the whole way things are done. 


Click Here to Read More:

https://thebigfatwhale.com/feds-latest-move-demise-of-arkk-and-innovation-stocks-quick-thoughts/

Friday, 24 December 2021

Is Grab A Worthwhile Investment?

Guest Post by: The Big Fat Whale 

UPDATE (24th Dec 21): Grab has the intention to acquire Jaya Grocers which is at a premium but it could be a good move to establish positive cash flows and sustainable earnings. From the influx of 4.5 billion dollars, acquiring profitable businesses that have synergies with their network would be the right path forward in our view.

Grab is very much part of our life if you reside in South East Asia- be it hailing a Grab taxi, ordering food from Grab food, arranging a courier service and now even catering to our insurance and financial needs. They have the title of being the SuperApp in South East Asia.

Recently, they have just launched their stock listing in Nasdaq through the merger with Altimeter Growth Corp which is a special purpose acquisition company (SPAC) valuing the deal at $40 billion. Grab raised $4.5 billion with this merger.

Truth be told, we were never interested in Grab as an investment, especially so with headlines of them losing billions per year plastered through different media outlets. Nonetheless, with this stock listing, we decided to understand the company better and see if a turnaround is in sight.


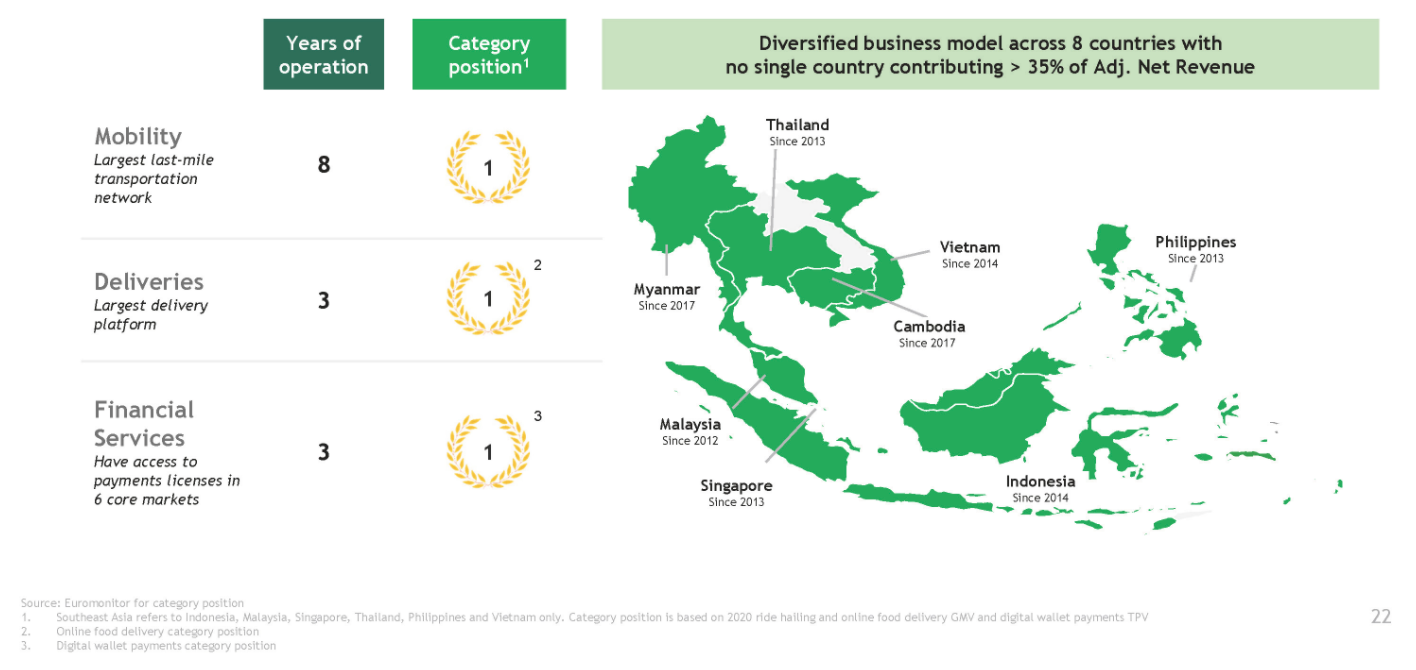
Grab Business Model


Source: Form 8k- Altimeter Growth Corp

Grab was started in Malaysia as MyTeksi in 2012 and within a span of 9 years, their business has now expanded tremendously to include 4 main categories. They are namely:

  • Mobile (Transport)
  • Deliveries (Food and Groceries)
  • Courier Express 
  • Financial Services (Fintech)


Their coverage now covers the 8 countries in South East Asia as illustrated from the diagram above.


Click Here to Read More:

https://thebigfatwhale.com/is-grab-a-worthwhile-investment/ 


Monday, 24 July 2017

Rowsley (Remisier King Midas Touch)


The Remisier King is waving his Midas touch yet again. His earlier moves have so far been disappointing. The solar story was full of promise with supposedly guaranteed profits seems to be now just a castle in the sky situation. Next was the Iskander grand plan which seems to have wind down given the huge oversupply situation.

Currently, Rowsley operations are mainly in the hospitality business in UK, their architect business through RSP and their real estate development in Vantage Bay Healthcare City.

With the recent deal of injecting Thomson Medical and TMC Life Sciences, could it be the winning touch for a sustainable uptrend in the stock?

Let's look at the numbers. Rowsley is going to purchase Mr Lim's stake of Thomson Medical and TMC Life Sciences at 1.9 billion sgd dollars. The takeover of Thomson Medical in 2010 was at a price of 513 million dollars and at a valuation of around 3.4X book value and 30x PE. TMC Life Sciences are currently trading at a PE of 66X.

In a Business Times article dated September 13th 2016, it was revealed that the revenue growth of Thomson Medical went up by almost a fold and assuming profits went up by the same rate. The current state of Thomson Medical should be worth close to 1 billion with the same valuation that Mr Lim took over considering the growth of their earnings. It seems to be a fair value as Raffles Medical is trading at 30x PE and 3.2x book value currently. Also, in the article, the CEO was saying if they were to list, they are able to get a valuation of 2 to 3 billion dollars but they are aiming for a 5 billion dollars valuation. I am not sure how did he get such a valuation unless they are intending to list at an inflated valuation and there are takers for it. 

Here is the article:

For TMC Life Sciences, it is trading at a PE of 66X which is even higher than IHH of 56X, so i presume Rowsley is paying a high price for this asset and Mr Lim's stake will be worth around 320 million Sgd dollars based on their current market capitalization.

Doing up the sums, a fair value for the assets could be around 1.3 billion dollars but he is injecting it in at a valuation of 1.9 billion dollars. The deal is structured by issuing 25.3 billion of Rowsley shares to Mr Lim at a price of $0.075. Given the recent decline in healthcare stocks, perhaps it was an optimal move to try to do the deal at a good valuation.

Valuation

To make things simplistic, we will assume that 1.9 billion dollars is a fair value (After my analysis, I think Rowsley overpaid thou) for the assets and assuming their current business will be trading at their book value (Around 400 million) given that it is loss making. We will have total shares of 30.5 billion excluding the warrants that will be issued with the deal. The valuation of Rowsley should be around $0.0755 (1.9 billion plus 400 million divided by 30.5 billion). Their warrants are going to be issue at exercise price of 9 cents and 12 cents for piggyback version. Currently, the price of Rowsley seems to be defying my valuation. 

As with all the Midas touches so far, the price of Rowsley have shot up tremendously and eventually came back to reality. Unless, there are further positive developments in their existing business or the profits or growth prospects of Thomson Medical are way above my estimates. My view is at best Rowsley is worth 10 to 12 cents and this valuation is consider rich.

Do take note, lots of assumptions goes into this valuation and so kindly do your own due diligence. I would term this as a trading stock at the moment and usually trading stocks do not follow fundamentals when the animal spirits are high. Do have a proper risk management in place.

Disclaimer:
The information contained in this publication is provided to you for general information only and is not intended to nor will it create/induce the creation of any binding legal relations. The information or opinions provided do not constitute investment advice, a recommendation, an offer or solicitation to subscribe for, purchase or sell the investment product(s) mentioned herein. It does not have any regard to your specific investment objectives, financial situation and any of your particular needs. Accordingly, no warranty whatsoever is given and no liability whatsoever is accepted for any loss arising whether directly or indirectly as a result of any person or group of persons acting on this information. Investments are subject to investment risks including possible loss of the principal amount invested. The value of the product and the income from them may fall as well as rise.

You may wish to obtain advice from a financial adviser before making a commitment to purchase any of the investment products mentioned herein. In the event that you choose not to obtain advice from a financial adviser, you should assess and consider whether the investment product is suitable for you before proceeding to invest.

Any views, opinions, references or other statements or facts provided in this publication are personal views and shall disclaim any liability for damages resulting from errors and omissions contained.

Thursday, 9 March 2017

US Market- On a Roll?

With the US indices (Dow and S&P) scaling all time highs, the Trump presidency has led to a surprisingly positive outcome for the equity markets. In a recent seminar, I was going through the US market outlook and i summed it up through the following points:

1) Valuation
2) Quantitative Easing Ended
3) Trumpnomics
4) Debt Levels
5) Monetary Policies
6) Global Economic Conditions
7) Technical Charts 

Valuation

Firstly, valuation of the S&P index is at the higher end of their recent range (2006 to 2016) and their PE is around 22 at the moment. We are actually not far off from the high (PE:24) during the Lehman crisis in 2008. Looking at the Price to Book Ratio, we are near 3 which was last registered in 2008 before the huge crash. Last but not least, looking at the Cyclically Adjusted Price Earnings Ratio which could smooth out outliers, we are at around 30 which is the highest level comparable to the levels before the Great Depression in 1928-1930 period. It however did reach close to 45 during the Dotcom Bubble. Enclosed are supporting charts to justify my analysis. In summary, the US indices definitely do not seem like a bargain from a valuation aspect.

Source: Bloomberg S&P Historical PE Ratio 

Source: Bloomberg S&P Historical Price to Book Ratio

Source: www.multpl.com
Quantitive Easing Ended. Start of a new era?

The quantitative easing (aka fossil fuel that has been driving the Dow Jones Index up from their abyss after Lehman crisis till 2015) has since taken a back seat. Now replacing it and driving the index higher in recent times will be Trumpnomics. 
Trumpnomics (explained in 4 parts):
1) Taxes- Reduction in Corporate Tax and Repatriation Tax Consession

With reduction in corporate taxes and repatriation tax concession (Companies like Google and Apple have lots of funds stash in overseas tax haven places), it will drive up business and investment activities and hopefully led to a multiplier effect that will out weigh the reduction in tax revenues. However, my personal belief is that big corporations would not take the bait and repatriate all funds back as the regulation could easily change if Trump do not get reelected in the future and they would not want the US authorities to have full disclosure of their overseas funds.
2) Fiscal Policies- Infrastructure Spending with notable investment such as "Great Wall of America"

There have been plans to spend close to 1 trillion dollars on infrastructure ( ie. revitalize America's aging roads, bridges, railways and airports) over a 10 year period to create jobs and sustainable growth for the US economy.
3) America First- Trade Protectionist Measure to drive up sectors such as Car Manufacturing

There have been concrete plans to bring back jobs such as car manufacturing back to US and if necessary, trade tariffs to protect the industry. There are talks with corporate honchos to bring jobs and investments to America. Companies such as General Motors, Hyundai, Walmart, Bayer AG and Alibaba have already committed to step up investments in US. My own thoughts are trade protectionist measure tends to work in the short run and might not be sustainable. According to Adam Smith’s "Invisible Hand Theory", it is best to let countries focus on what they are most efficient in producing and it will lead to an increase in overall output. Rather than sprucing up industries which US does not have a competitive advantage, they should invest into skill training and migrating workers to other industries which US has an edge or the indispensable services industries.
4) Dodd Frank - To deregulate or to regulate?

There have been talks that there will be deregulation of the Dodd Frank Act which was enacted after the Lehman crisis. Dodd Frank Act has consumers’ interests at heart, this in turn made it extremely onerous for banks and thus affected their bottom-line. The talk of de-regulation had US financials rallied after Trump was elected. Nevertheless, this would be easier said than done - this can’t be just a one man show and it will need Congress' approval which would take a long time before they can come up with some consensus.
Debt Levels and Monetary Policy

Looking at Margin debt and Government debt level, the US is currently on a high note at around 500 billion dollars and 19 trillion dollars (106 percent to GDP) respectively. The highest level registered was around 120 percent during the 1940s. We are facing the passing of the lifting of the debt ceiling on March 15th which has been set at around 20 trillion dollars and if the debt ceiling is not lifted, the US government could not borrow anymore.

With such a huge debt load and inflation within control, I feel that the US Federal reserve would not be in a rush to lift interest rates aggressively as a lower interest would make it easier to pare down the debt level. Nonetheless, the guidance from Fed will be for 3 rate hikes this year. In general, lower interest rate will be good for the equities markets but a gradual increase would signify that the economy is doing well. What we do not wish to see is an aggressive hikes policy such as during the late 1990s under Greenspan period.

Source:Dshort.com

Source: CNBC
Global Economic Conditions

Global market conditions have been pretty stagnant and we are looking at around 1-2 percent growth for most regions whereby China has also slowed their growth to around the 6 percent region. Moreover with America First Policy, growth in other regions seem to remain status quo. Thus given such a backdrop, there is no real catalyst for sustainable growth Ex America regions.

Technical Charts

Looking at the Technical Charts, it certainly is a on a good uptrend and having breach their all time high of around 18,500, it seems the stage is set for further upside. Using Fibonaci projection, we could be looking at a potential target of 22,000 for Dow Jones in the near future.

Source: IT-Finance.com

In short, weighing the different factors, I will be cautiously bullish and choice entry level will around 19,500-20,000 levels and a break below 18,500 would require us to revisit our bullish thesis. However, is this going to lead to multi years of bull run? My thoughts will be that the Trump policies are pretty short term positive in nature. At this juncture, I doubt it will pan out well as protectionist measures are usually not effective in the long haul. Therefore, there might be another bullish leg but the indices seems to have priced in most of the positives at this moment.
Disclaimer:
The information contained in this publication is provided to you for general information only and is not intended to nor will it create/induce the creation of any binding legal relations. The information or opinions provided do not constitute investment advice, a recommendation, an offer or solicitation to subscribe for, purchase or sell the investment product(s) mentioned herein. It does not have any regard to your specific investment objectives, financial situation and any of your particular needs. Accordingly, no warranty whatsoever is given and no liability whatsoever is accepted for any loss arising whether directly or indirectly as a result of any person or group of persons acting on this information. Investments are subject to investment risks including possible loss of the principal amount invested. The value of the product and the income from them may fall as well as rise.

You may wish to obtain advice from a financial adviser before making a commitment to purchase any of the investment products mentioned herein. In the event that you choose not to obtain advice from a financial adviser, you should assess and consider whether the investment product is suitable for you before proceeding to invest.

Any views, opinions, references or other statements or facts provided in this publication are personal views and shall disclaim any liability for damages resulting from errors and omissions contained.